
Vision - Advanced Session Indicator
อินดิเคเตอร์
6 การซื้อ
เวอร์ชัน 1.0, Jul 2025
Windows, Mac
5.0
รีวิว: 2
คำอธิบาย
ตัวบ่งชี้เซสชันขั้นสูง
คำอธิบาย:
ตัวบ่งชี้เซสชันมืออาชีพสำหรับ cTrader ที่แสดงช่วงราคาของเซสชันการซื้อขายหลักและเพิ่มการวิเคราะห์โปรไฟล์ปริมาณสำหรับแต่ละเซสชัน
คุณสมบัติหลัก:
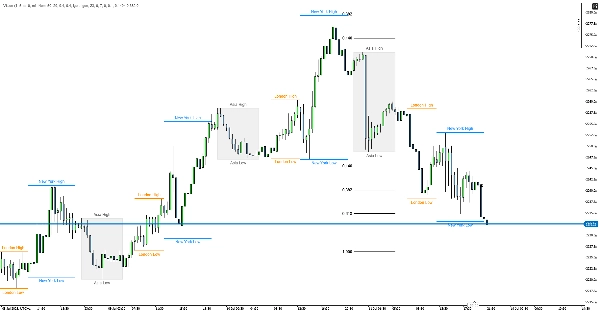
📊 กล่องและเส้นราคาของเซสชัน
- 4 เซสชันการซื้อขายหลัก: เอเชีย, แฟรงก์เฟิร์ต, ลอนดอน, นิวยอร์ก
- เวลาที่ปรับแต่งได้เต็มที่: แต่ละเซสชันสามารถตั้งค่าแยกกันได้
- กล่องและเส้นช่วงราคาที่มีรหัสสี: แสดงค่าสูง/ต่ำของแต่ละเซสชันอย่างชัดเจน
- การจัดการโซนเวลาที่อัตโนมัติ
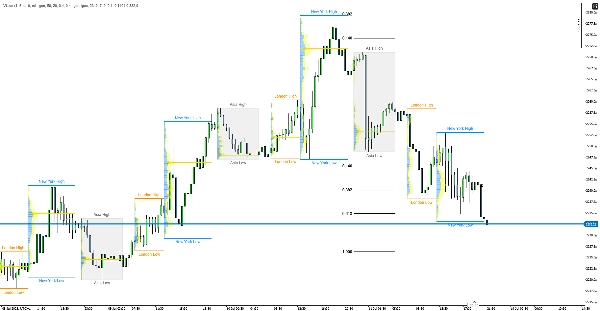
📈 โปรไฟล์ปริมาณของเซสชัน
- การแสดงการกระจายปริมาณ: โปรไฟล์ปริมาณแยกสำหรับแต่ละเซสชัน
- ปริมาณซื้อ/ขาย: สีแยกต่างหาก (น้ำเงิน/เหลือง)
- POC (จุดควบคุม): การทำเครื่องหมายระดับราคาปริมาณสูงสุด
- ความละเอียดที่ปรับแต่งได้: ฮิสโตแกรมปริมาณระดับ 10-500
การตั้งค่า
เวลาของเซสชัน
- เอเชีย: 23:00-07:00 (สีเทา)
- แฟรงก์เฟิร์ต: 07:00-08:00 (สีเขียวเข้ม)
- ลอนดอน: 09:00-14:00 (สีส้ม)
- นิวยอร์ก: 14:00-22:00 (สีน้ำเงิน)
ตัวเลือกที่ปรับแต่งได้
- ความโปร่งใสและสีของกล่องและเส้น
- การขยายเซสชันเอเชียที่แตกต่างกัน
- ความกว้างและความโปร่งใสของฮิสโตแกรมปริมาณ
- จำนวนวันที่จะแสดง
- การแสดงเส้น POC
- กรอบเวลาที่แยกต่างหากสำหรับกล่องเซสชันและโปรไฟล์ปริมาณ
การใช้งาน
การประยุกต์ใช้ในการซื้อขาย:
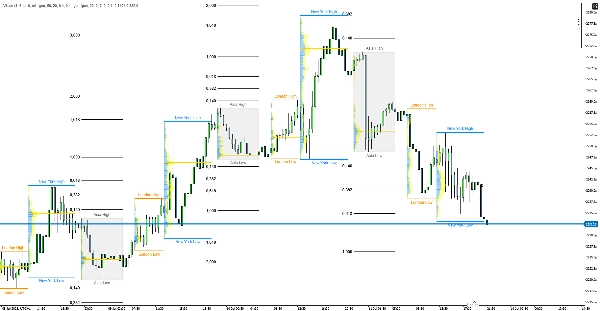
- ระดับสูง/ต่ำของเซสชันเป็นจุด S/R
- กลุ่มปริมาณเพื่อทำเครื่องหมายระดับสำคัญ
- เส้น POC เป็นระดับแม่เหล็ก
- การทับซ้อนของเซสชันที่เน้นความสำคัญ
ข้อดี: การรวมกันของการวิเคราะห์ราคากับปริมาณ, การอัปเดตแบบเรียลไทม์, การปรับแต่งได้เต็มที่, รูปลักษณ์มืออาชีพ
สรุป
สรุปโดย AI
Vision - Advanced Session Indicator is a professional tool designed for the cTrader platform to visualize and analyze major trading sessions: Asia, Frankfurt, London, and New York. It displays session price ranges using color-coded boxes and lines, highlighting high and low values for each session. The indicator supports full customization of session times, colors, transparency, and display settings, including separate timeframes for session boxes and volume profiles.
Key features include a session volume profile that shows volume distribution with distinct buy/sell volume colors and marks the Point of Control (POC), the price level with the highest traded volume. Users can customize the volume histogram resolution from 10 to 500 levels. The indicator automatically handles time zones and adjusts for Daylight Saving Time to ensure accurate session tracking.
Vision aids traders by marking session high/low levels as support and resistance points, identifying volume clusters and liquidity zones, and highlighting session overlaps. It is particularly useful for day traders seeking detailed insights into market behavior and potential entry levels based on volume and price action across different trading sessions.
โปรไฟล์อินดิเคเตอร์
รีวิวจากลูกค้า
5.0
รีวิว: 2
5 | 100 % | |
4 | 0 % | |
3 | 0 % | |
2 | 0 % | |
1 | 0 % |
รีวิวจากลูกค้า
July 27, 2025
The entry needs one more reason to make sense, but the market context still matters.
July 15, 2025
The practical angle is weak trade ideas become less attractive, and signal count matters more than one nice example.
การสนทนา
คำถามที่พบบ่อย
Prop
Forex
Indices
Crypto
ผลิตภัณฑ์ที่มีให้บริการผ่าน cTrader Store รวมถึงบอทการเทรด อินดิเคเตอร์ และปลั๊กอิน มีให้บริการโดยนักพัฒนาบุคคลที่สามและมีไว้เพื่อวัตถุประสงค์ในการเข้าถึงข้อมูลและทางเทคนิคเท่านั้น cTrader Store ไม่ใช่โบรกเกอร์และไม่ได้ให้คำแนะนำการลงทุน คำแนะนำส่วนบุคคล หรือการรับประกันผลการดำเนินงานในอนาคต


ราคา
ตั้งแต่ 05/01/2025
14
การขาย