
Average Cost Price
อินดิเคเตอร์
1 การซื้อ
เวอร์ชัน 1.0, Sep 2025
Windows, Mac
4.5
รีวิว: 2
คำอธิบาย
การกำหนดราคาต้นทุนเฉลี่ยสำหรับการเทรดหลายรายการเป็นเรื่องยาก การตั้งค่า Stop Loss และ Take Profit จึงเป็นเรื่องยากเพราะราคาต้นทุนเฉลี่ยของการเทรดหลายรายการไม่เป็นที่ทราบ
ตัวบ่งชี้ราคาต้นทุนเฉลี่ยจะให้คุณ:
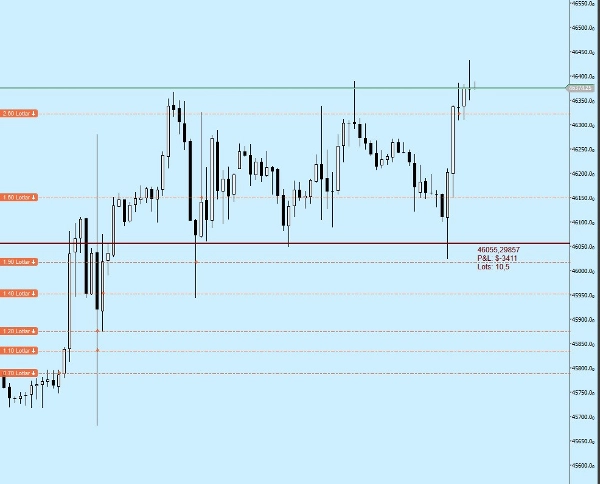
* เส้นราคาซื้อหรือขายเฉลี่ย,
* จำนวนกำไรหรือขาดทุนรวมตามเส้นราคาต้นทุนเฉลี่ย,
* ปริมาณล็อตรวม
สรุป
สรุปโดย AI
Average Cost Price is a trading indicator designed to help traders monitor their open positions directly on the chart. It calculates and displays the average buy or sell price line for multiple trades, simplifying the process of managing positions with varying entry prices. The indicator also shows the total profit or loss amount based on this average cost line, providing a clear overview of overall position performance. Additionally, it tracks the total lot quantity held. This tool supports various markets including Forex, Stocks, Commodities, Crypto, and Indices, and is applicable to symbols such as BTCUSD, EURUSD, GBPUSD, XAUUSD, and USDJPY. By consolidating multiple trade entries into a single average cost metric, it aids in setting more accurate Stop Loss and Take Profit levels.
โปรไฟล์อินดิเคเตอร์
รีวิวจากลูกค้า
4.5
รีวิว: 2
5 | 50 % | |
4 | 50 % | |
3 | 0 % | |
2 | 0 % | |
1 | 0 % |
รีวิวจากลูกค้า
October 3, 2025
ngl, trade control feels cleaner and that is enough to keep testing it. Win rate means less without average R.
October 1, 2025
The tool feels better once the workflow feels calmer, and spread and slippage need a line in the notes.
การสนทนา
คำถามที่พบบ่อย
BTCUSD
Prop
Forex
Indices
EURUSD
Commodities
GBPUSD
Crypto
Stocks
XAUUSD
USDJPY
ผลิตภัณฑ์ที่มีให้บริการผ่าน cTrader Store รวมถึงบอทการเทรด อินดิเคเตอร์ และปลั๊กอิน มีให้บริการโดยนักพัฒนาบุคคลที่สามและมีไว้เพื่อวัตถุประสงค์ในการเข้าถึงข้อมูลและทางเทคนิคเท่านั้น cTrader Store ไม่ใช่โบรกเกอร์และไม่ได้ให้คำแนะนำการลงทุน คำแนะนำส่วนบุคคล หรือการรับประกันผลการดำเนินงานในอนาคต


ราคา
ตั้งแต่ 01/09/2025
1
การขาย