
คำอธิบาย
Advanced Pro Volume Profile: Institutional Fixed Range & Order Flow
ยกระดับการวิเคราะห์ตลาดของคุณด้วย Advanced Pro Volume Profile ตัวบ่งชี้ระดับสถาบันที่ได้รับการปรับแต่งอย่างสูงสำหรับนักเทรด สร้างขึ้นสำหรับนักเทรดรายวัน สแคปเปอร์ และสวิงเทรดเดอร์ที่พึ่งพาทฤษฎีตลาดประมูล เครื่องมือนี้นำความแม่นยำสู่การกระจายปริมาณ พื้นที่มูลค่า และพลวัตของการไหลของคำสั่ง
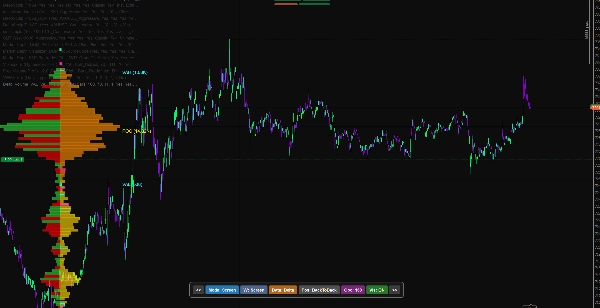
ไม่เหมือนโปรไฟล์ปริมาณค้าปลีกทั่วไปที่คำนวณใหม่ เปลี่ยนตำแหน่ง หรือแตกหักเมื่อคุณซูมเข้าและออก ตัวบ่งชี้นี้นำเสนอ โหมดสมอแท้จริง (ช่วงคงที่) พร้อมการเก็บความจำ ทำให้เป็นเครื่องมือที่ดีที่สุดสำหรับการเทรดสดและการย้อนกลับประวัติอย่างเข้มงวด
🔥 คุณสมบัติหลัก & ข้อได้เปรียบในการเทรด
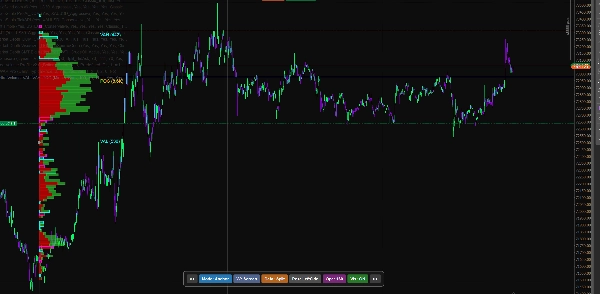
1. โหมดสมอแท้จริง (เหมาะสำหรับการย้อนกลับ)
เลิกต่อสู้กับโปรไฟล์ที่เปลี่ยนตำแหน่ง! ด้วย โหมดสมอ คุณสามารถวางเส้นแนวตั้งแบบโต้ตอบสองเส้นที่ใดก็ได้บนแผนภูมิของคุณเพื่อวิเคราะห์สวิง เซสชัน หรือโซนการรวมตัวเฉพาะ
- ไม่มีการบิดเบือน: ซูมเข้า ซูมออก หรือเลื่อน—โปรไฟล์จะถูกล็อกทางคณิตศาสตร์กับจุดสมอที่คุณเลือกไว้
- ย้อนกลับประวัติ: เลื่อนย้อนกลับเป็นเดือนหรือปี ยึดโปรไฟล์กับเหตุการณ์ตลาดในอดีต และวิเคราะห์การกระจายปริมาณและจุดควบคุม (POC) ที่เกิดขึ้นจริง สมอจะจดจำตำแหน่งที่แน่นอน ทำให้คุณศึกษาการตั้งค่าที่ผ่านมาได้อย่างสมบูรณ์แบบโดยไม่มีการรีเซ็ตกริด
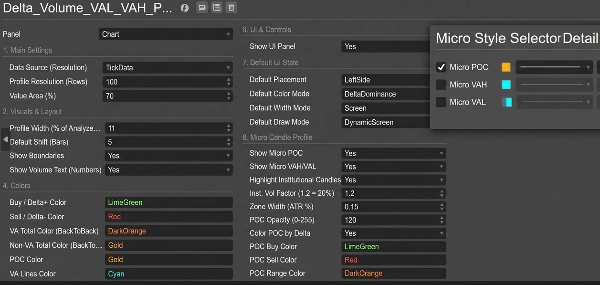
2. แผง UI แบบโต้ตอบบนแผนภูมิ
ไม่จำเป็นต้องเปิดการตั้งค่าตัวบ่งชี้บ่อยๆ แผง UI ที่เรียบง่ายและไม่รบกวนที่ด้านล่างของแผนภูมิของคุณช่วยให้คุณ:
- สลับระหว่าง โหมดหน้าจอ (ไดนามิก) และ โหมดสมอ (ช่วงคงที่) ด้วยคลิกเดียว
- เลื่อนตำแหน่งโปรไฟล์ (ซ้าย ขวา ต่อเนื่อง)
- ปรับความกว้างและความทึบแสงได้ทันที
- สลับระหว่าง การแยกซื้อ/ขาย และ ความโดดเด่นของเดลต้า ในการระบายสีปริมาณ
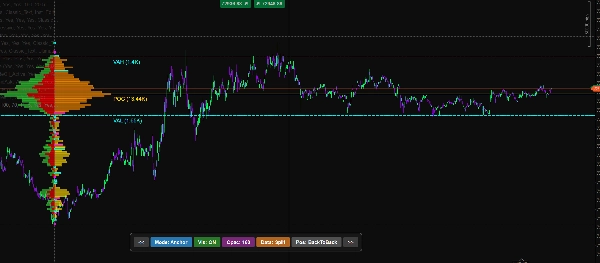
3. ข้อมูลเชิงลึกลึกซึ้งเกี่ยวกับการไหลของคำสั่ง
อ่านโครงสร้างจุลภาคของตลาดเหมือนมืออาชีพ:
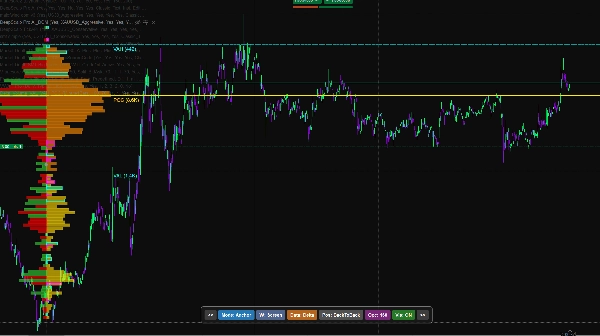
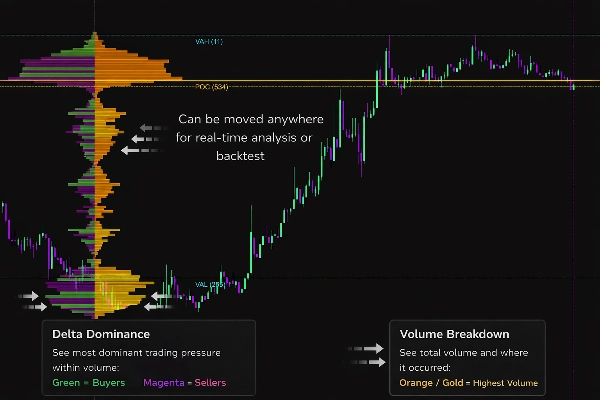
- ความโดดเด่นและการแยกเดลต้า: แสดงภาพการซื้อขายตลาดที่รุนแรงเทียบกับการขายตลาดภายในแต่ละโหนดราคา
- ความไม่สมดุลของปริมาณ: ตรวจจับและเน้นความไม่สมดุลของการซื้อ/ขายจำนวนมากโดยอัตโนมัติ (อัตราส่วนปรับแต่งได้ เช่น ความโดดเด่น 300%) เพื่อสังเกตการดูดซับของสถาบันหรือการเบรกเอาต์ที่รุนแรง
- การตรวจจับ HVN & LVN: ระบุอย่างชัดเจนโหนดปริมาณสูง (แม่เหล็กราคาที่ดึงดูด) และโหนดปริมาณต่ำ (ช่องว่างสภาพคล่องที่ราคาขยับอย่างรวดเร็ว)
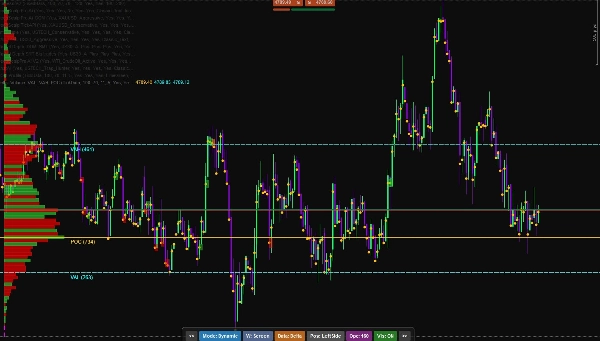
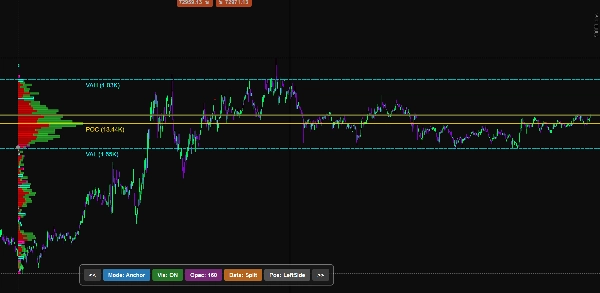
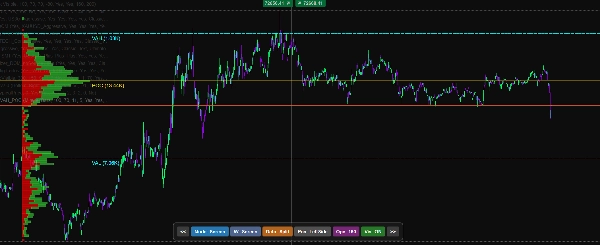
4. พื้นที่มูลค่าไดนามิก & POC เปลือย
- แสดง ค่าสูงของพื้นที่มูลค่า (VAH) และ ค่าต่ำของพื้นที่มูลค่า (VAL) อย่างแม่นยำโดยอิงจากส่วนเบี่ยงเบนมาตรฐาน (ค่าเริ่มต้น 70%)
- เน้น จุดควบคุม (POC).
- ขยาย POC เปลือย: ขยายเส้น POC ที่ไม่ได้ตรวจสอบไปข้างหน้าโดยอัตโนมัติ มอบเป้าหมายการสนับสนุนและต้านทานที่ตอบสนองสูงให้กับคุณ
5. ปรับแต่งอย่างสูง
- แหล่งข้อมูล: เลือกระหว่างข้อมูล Tick ที่แม่นยำสูงหรือข้อมูลแท่ง 1 นาทีที่เบาสำหรับการวิเคราะห์ประวัติระยะยาว
- การเรนเดอร์อัจฉริยะ: ออกแบบมาเพื่อจัดการข้อมูลจำนวนมากโดยไม่ทำให้แพลตฟอร์มของคุณค้าง
🛠️ วิธีใช้เพื่อการเรียนรู้เมื่อไม่ได้เทรด:
- เลื่อนย้อนกลับไปยังวันที่ที่คุณต้องการบนแผนภูมิ
- คลิก "โหมด: สมอ" บนแผง UI
- ลากเส้นประแนวตั้งสองเส้นเพื่อครอบคลุมสวิงราคาหรือเซสชันการเทรดที่คุณต้องการวิเคราะห์อย่างแม่นยำ
- โปรไฟล์ปริมาณจะถูกสร้างขึ้นทันที คุณสามารถซูมเข้าไปยังแผนภูมิ 1 นาทีเพื่อตรวจสอบจุดเข้า ความไม่สมดุล และการทดสอบซ้ำของพื้นที่มูลค่าโดยที่โปรไฟล์ไม่สูญเสียตำแหน่ง!
ควบคุมแผนภูมิของคุณ เลิกเทรดตามรูปแบบค้าปลีกและเริ่มเทรดตามปริมาณสถาบัน
สรุป
An interactive on-chart UI panel enables quick toggling between dynamic Screen Mode and fixed Anchor Mode, profile position adjustments, visual customization, and switching between Buy/Sell Split and Delta Dominance volume coloring. The tool offers deep order flow insights, including visualization of aggressive buying versus selling, automatic detection of volume imbalances, and identification of High Volume Nodes (HVN) and Low Volume Nodes (LVN).
It displays dynamic Value Area High (VAH), Value Area Low (VAL), and Point of Control (POC) lines, with an option to extend naked POC lines as future support/resistance targets. Users can select data sources between tick data and 1-minute bars for optimized performance and historical analysis. The indicator is engineered for efficient rendering to handle large datasets without platform lag.
รีวิวจากลูกค้า
5 | 50 % | |
4 | 50 % | |
3 | 0 % | |
2 | 0 % | |
1 | 0 % |


