
Descrição
Um dos maiores erros que os traders iniciantes cometem é tentar criar o máximo de informação possível em um gráfico adicionando muitos indicadores, e o resultado é um gráfico cheio de ruído com linhas e dados que fornecem todo tipo de informação sem sentido que dão ao trader uma história conflitante.
Prós:
- Precisão impressionante na detecção de reversões.
- Visualmente agradável e fácil de ver as condições do mercado.
- Pode ser usado como um indicador de negociação de tendência ou um indicador de negociação contra a tendência.
- Resultados fortes em back-testing (~95% de precisão em sinais Extremos).
Contras:
- Mesmo com condições de "Extremo" Sobrecomprado e "Extremo" Sobrevendido, o indicador às vezes pode fazer você operar na direção oposta de uma tendência muito forte, causando grandes perdas antes que o preço eventualmente reverta.
- Sinais de "Extremo" Sobrecomprado e "Extremo" Sobrevendido podem ser raros ao operar no timeframe de 15 minutos ou superior. Para contornar isso, recomenda-se operar pelo menos 8 pares principais para receber sinais Extremos com frequência.
Como usar o Chaos Reversals
Um sistema simples e vencedor usando Chaos pode ser feito marcando linhas semanais e diárias de Suporte e Resistência e operando contra a tendência nos rebotes que se aproximam dessas linhas de suporte e resistência usando os sinais de Extremo Sobrecomprado e Extremo Sobrevendido do Chaos de 15 minutos.
Os sinais são gerados da seguinte forma:
- O W%R rápido se move primeiro, seguido pelo W%R lento.
- Quando o W%R rápido único está Sobrevendido ou Sobrecomprado, você pode fazer scalping nessas reversões.
- Quando ambos, W%R rápido e lento, estão Sobrevendidos ou Sobrecomprados, isso indica que o mercado vai reverter por uma quantidade significativa.
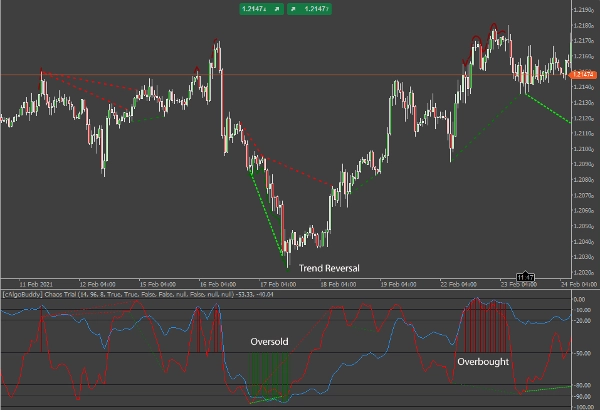
O indicador desenhará uma linha vermelha ou verde sobre as mínimas ou máximas no gráfico de preços, assim como linhas vermelhas ou verdes na área do indicador para marcar as condições extremas de sobrecompra ou sobrevenda. Você pode desativar isso nas opções do indicador.
Identificando Divergências
Como o W%R é um oscilador, ele nos dá a oportunidade de identificar e operar divergências. Existem dois tipos principais de Divergência: Regular e Oculta.
- Divergência regular é uma indicação de reversão na direção do preço.
- Divergência oculta é uma indicação de continuação na direção do preço.
Dentro de cada tipo principal, há uma classificação secundária: Baixista (Negativa) e Altista (Positiva).
- Uma divergência baixista ocorre quando o indicador se move para baixo enquanto o preço sobe ou se mantém estável.
- Uma divergência altista ocorre quando o indicador se move para cima enquanto o preço cai ou se mantém estável.
Divergência Regular
Divergência Regular em termos simples é quando:
- O preço está fazendo máximas mais altas enquanto a linha rápida do W%R está fazendo máximas mais baixas: Potencial venda.
- O preço está fazendo mínimas mais baixas enquanto a linha rápida do W%R está fazendo mínimas mais altas: potencial compra.
Em ambos os casos, o trader busca uma potencial reversão na ação do preço.
A divergência regular é melhor usada como uma comparação do Swing High ou Swing Low atual com o Swing High ou Swing Low anterior. Com a divergência regular, a tendência está enfraquecendo e o sentimento do mercado mudou na direção oposta. Os traders podem se preparar para operar uma reversão ou retração favorável.
No Chaos Reversals, a divergência regular é mostrada da seguinte forma:
- Divergência Regular Altista – Linha verde brilhante tracejada estreita.
- Divergência Regular Baixista – Linha vermelha tracejada estreita
NOTA: As linhas de divergência aparecem na abertura da barra seguinte a uma divergência confirmada.
Divergência Oculta
Divergência Oculta em termos simples é quando:
- A linha rápida do W%R está fazendo mínimas mais baixas enquanto o preço está fazendo mínimas mais altas: um potencial compra.
- A linha rápida do W%R está fazendo máximas mais altas enquanto o preço está fazendo máximas mais baixas: um potencial venda.
Em ambos os casos, o trader busca uma potencial continuação na ação do preço.
A divergência oculta é melhor usada para avaliar preços relacionados à tendência predominante. Após um recuo, o preço frequentemente continuará na direção da tendência em direção ao nível do último Swing High ou Swing Low. Com a divergência oculta, a tendência pode estar enfraquecendo, mas ainda não foi concluída. Como mostrado abaixo, o mercado recuou provavelmente devido à realização de lucros e parece retomar a tendência de baixa.
No Chaos Reversals, a divergência oculta é mostrada da seguinte forma:
- Divergência Oculta Baixista – Linha verde tracejada larga
- Divergência Oculta Altista – Linha vermelha escura tracejada larga
Operando com Divergência
Esta é uma nota rápida de cautela ao operar com Divergência. Esteja ciente de que o mercado pode não se mover na direção de um sinal de Divergência. É importante entender que a Divergência é uma indicação de uma potencial mudança ou continuação na direção do mercado. É importante monitorar o movimento do preço para confirmar a direção do mercado. Além disso, observe a direção geral do Indicador Chaos, comparando as linhas do indicador com os níveis (0 para extremo sobrecomprado, -100 para extremo sobrevendido)
Alertas e Notificações
Os sinais que serão enviados são o início e fim dos Extremos Sobrecomprado/Sobrevendido, pico do W%R lento em posições extremas, bem como todas as divergências.
Alertas no Telegram
Desde que você tenha um bot e um canal configurados no Telegram, o indicador Chaos Reversals enviará mensagens para sinais confirmados no par de moedas.
IMPORTANTE:
Por favor, certifique-se de que seu Fuso Horário está corretamente ajustado para o seu horário local (canto inferior direito da aplicação).
Alertas na Área de Trabalho
Se você selecionar Sim, o indicador Chaos Reversals enviará uma notificação em caixa de mensagem para sinais confirmados em sua área de trabalho pessoal.
Alertas por Email
Para que essa funcionalidade funcione, você deve primeiro configurar seu cTrader para poder enviar emails (Configurações-> Email).
Resumo
Avaliações de clientes
5 | 100 % | |
4 | 0 % | |
3 | 0 % | |
2 | 0 % | |
1 | 0 % |


![Logótipo de "Smart Money Concepts (SMC) [Iridio Capital]"](https://cdn.ctrader.com/image/webp/28b69fd1-ef54-4bed-9487-07e78e883be4_40934)


