

Descrizione
PROFILO VOLUME A INTERVALLO FISSO (FRVP)
Indicatore di Profilo Volume con Rilevamento Automatico
--------------------------------------------------
Distribuzione del volume. Aree di valore. Nodi ad alto volume. Tutto dalla tua trendline.
--------------------------------------------------
COS'È QUESTO INDICATORE
Il Profilo Volume a Intervallo Fisso (FRVP) mostra la distribuzione del volume su un intervallo definito dall'utente — rilevando automaticamente l'ultima trendline che disegni sul grafico.
Non è necessaria la selezione manuale dell'intervallo. Basta disegnare una trendline e il profilo appare.
--------------------------------------------------
CARATTERISTICHE PRINCIPALI
- RILEVA AUTOMATICAMENTE l'ultima trendline (non è necessario nominare manualmente)
- Punto di Controllo (POC) - livello di volume più alto
- Area di Valore (VAH + VAL) - percentuale configurabile (default 70%)
- Nodi ad Alto Volume (HVN) - volume sopra la soglia media
- Visualizzazione istogramma (lato sinistro o destro dell'intervallo)
- Righe configurabili (da 10 a 200)
- Colori e opacità personalizzabili
- Estendi le linee verso destra
- Mostra/nascondi etichette dei prezzi
- Nessun repainting
--------------------------------------------------
COME FUNZIONA
1. Disegna una trendline sul grafico
2. L'indicatore la rileva automaticamente
3. Il profilo volume viene calcolato dall'intervallo
4. Vengono mostrati POC, VAH, VAL e HVN
Nessuna denominazione richiesta. Nessuna selezione manuale dell'intervallo.
--------------------------------------------------
ELEMENTI VISIVI
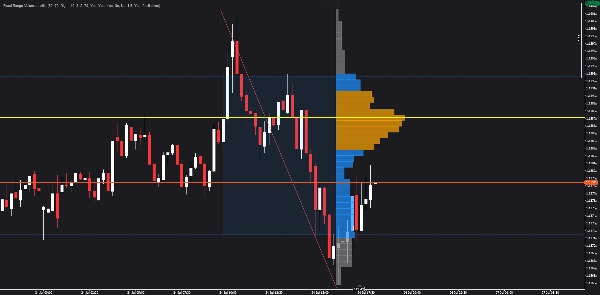
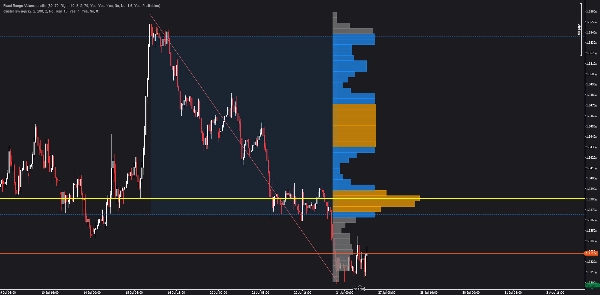
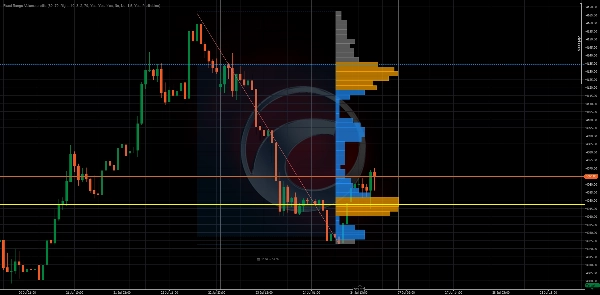
- Linea orizzontale gialla = Punto di Controllo (POC)
- Linee tratteggiate blu = Valore Alto (VAH) e Valore Basso (VAL)
- Barre arancioni = Nodi ad Alto Volume (HVN)
- Barre grigie = Nodi a basso volume
- Regione ombreggiata = Area di Valore (70% del volume)
- Istogramma = Distribuzione del volume per livello di prezzo
--------------------------------------------------
PANORAMICA DEI PARAMETRI
IMPOSTAZIONI DEL PROFILO:
- Numero di Righe: Quante righe di prezzo (10-200)
- Percentuale Area di Valore: % di volume nell'area di valore (1-100)
IMPOSTAZIONI VISIVE:
- Lato Profilo: Sinistro o Destro dell'intervallo
- Larghezza Istogramma %: Larghezza delle barre dell'istogramma
- Scala Larghezza Barre: Fattore di scala per la larghezza delle barre
- Larghezza Minima Barre %: Larghezza minima delle barre
- Opacità Barre: Trasparenza delle barre (10-100)
COLORI:
- Colore POC
- Colore Area di Valore
- Colore Nodo ad Alto Volume
- Colore Volume Basso
NODI AD ALTO VOLUME:
- Soglia HVN: Moltiplicatore di volume per qualificarsi come HVN
IMPOSTAZIONI TRENDLINE:
- Rilevamento Automatico Ultima: Trova automaticamente l'ultima trendline
- Nome Trendline Manuale: Specifica un nome (se il rilevamento automatico è disattivato)
--------------------------------------------------
CASI D'USO
- Identificare dove si è verificato il maggior volume
- Trovare il Punto di Controllo (POC) per ingressi/uscite
- Usare l'Area di Valore (VAH/VAL) per obiettivi di profitto
- Individuare Nodi ad Alto Volume (HVN) per livelli chiave
- Comprendere la distribuzione del volume a colpo d'occhio
- Combinare con altri indicatori per conferme
--------------------------------------------------
AGGIORNAMENTO A STRUCTURAL HEAT ZONES
Questo indicatore mostra la distribuzione del volume.
Structural Heat Zones va oltre — mappa l'intensità di partecipazione, accettazione vs rifiuto e l'impegno del mercato attraverso più zone.
Cerca Structural Heat Zones nel cTrader Store.
--------------------------------------------------
AGGIORNAMENTO A INVICTUS EA
Invictus EA utilizza la tecnologia strutturale per eseguire operazioni automatizzate.
Cerca Invictus nel cTrader Store.
--------------------------------------------------
NOTE TECNICHE
- Indicatore sovrapposto
- Funziona su qualsiasi timeframe e simbolo
- Nessun repainting (calcolo storico)
- Ottimizzato per le prestazioni
--------------------------------------------------
SUPPORTO
Aggiornamenti a vita inclusi.
PER ULTERIORI INFORMAZIONI - Clicca sul Profilo dello Sviluppatore qui sotto.





























