
Beschreibung
Der Final Moving Average ist ein technisches Werkzeug der nächsten Generation, das für Trader entwickelt wurde, die Präzision, Anpassungsfähigkeit und Klarheit in ihren Charts verlangen. Im Gegensatz zu traditionellen gleitenden Durchschnitten, die feste Perioden verwenden und oft dem Markt hinterherhinken, basiert dieser Indikator auf einem intelligenten adaptiven Algorithmus, der sich dynamisch an die Marktvolatilität und das Handelsvolumen anpasst.
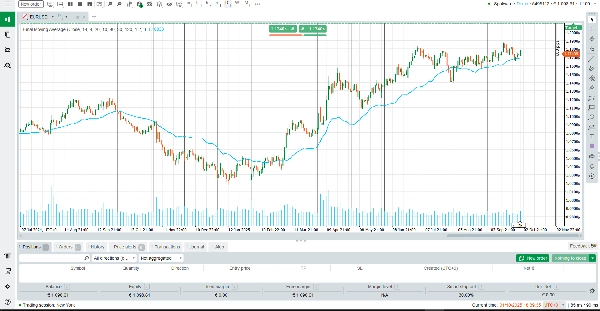
Wie man den Indikator liest
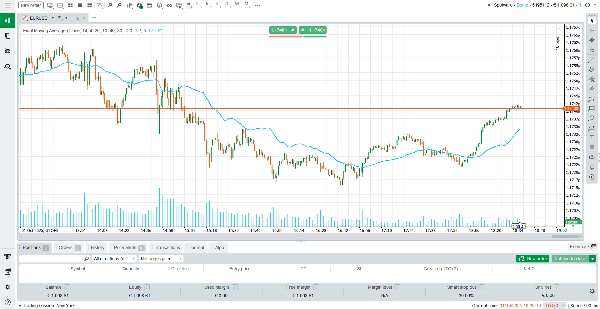
Linienrichtung:
Ein nach oben geneigter Final Moving Average zeigt einen Aufwärtstrend an.
Eine nach unten geneigte Linie signalisiert einen Abwärtstrend.
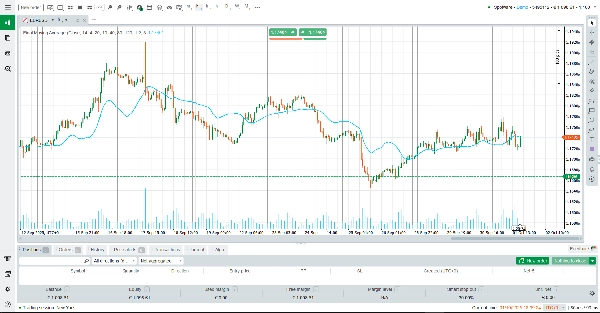
Preisinteraktion:
Wenn der Preis die Linie nach oben durchbricht, deutet dies auf den Beginn eines möglichen Aufwärtsmomentums hin.
Wenn der Preis die Linie nach unten durchbricht, warnt dies vor möglichem Abwärtsmomentum.
Marktanpassung:
In Phasen hoher Volatilität reagiert die Linie schneller und wird empfindlicher gegenüber schnellen Bewegungen.
In ruhigen Märkten glättet sie und filtert Rauschen heraus, wodurch die Trendrichtung klarer wird.
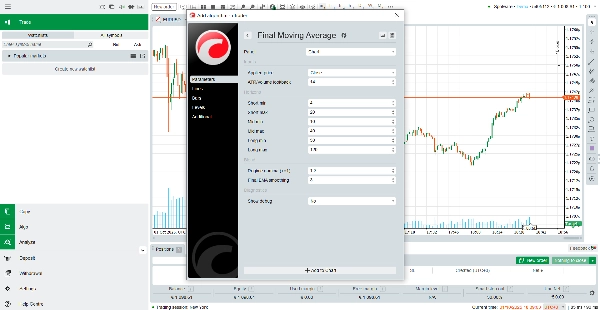
Glättungsfunktion:
Eine zusätzliche EMA-Glättung kann angewendet werden, wodurch Trader je nach Handelsstil zwischen einem reaktionsschnelleren oder einem stabileren Signal wählen können.
Hauptmerkmale
Intelligenter adaptiver Algorithmus – passt sich automatisch an Volatilität und Volumen an.
Höhere Genauigkeit – reduziert falsche Signale im Vergleich zu Standard-Gleitenden Durchschnitten.
Universelle Anwendung – funktioniert bei Forex, Indizes, Rohstoffen und sogar Kryptomärkten.
Klare und einfache Visualisierung – dargestellt als eine leuchtend himmelblaue Linie, der leicht zu folgen ist.
Abschließende Worte
Der Final Moving Average ist mehr als nur eine Linie im Chart – es ist ein komplettes adaptives System, das Trader mit der wahren Marktrichtung in Einklang bringt. Egal, ob Sie ein kurzfristiger Scalper sind, der eine schnellere Reaktion auf Volatilität sucht, oder ein Swing-Trader, der glattere Langzeitsignale bevorzugt, dieser Indikator bietet das Gleichgewicht, das Sie benötigen.
Indem Preis, Volatilität und Volumen in einem intelligenten gleitenden Durchschnitt kombiniert werden, gibt Ihnen der Final Moving Average die Kraft, bessere, klarere und schnellere Handelsentscheidungen zu treffen.
Zusammenfassung
Kundenbewertungen
5 | 100 % | |
4 | 0 % | |
3 | 0 % | |
2 | 0 % | |
1 | 0 % |


![„Gaussian Channel [Iridio Capital]“-Logo](https://cdn.ctrader.com/image/webp/7c039209-5573-4a54-a072-f9528b503103_41960)


