
Penerangan
Pengesan Lilin Besar
(oleh Avydel Talbo – Pedagang Prop Firm di The5%ers & OFP)
Kini tersedia untuk cTrader!
Pada asalnya dibangunkan untuk MT5, ATR Big Candle Detector oleh Avydel Talbo adalah alat yang kukuh direka untuk membantu pedagang mengenal pasti zon tindakan harga utama dan corak lilin yang signifikan dengan cekap dan tepat.
Gambaran Keseluruhan
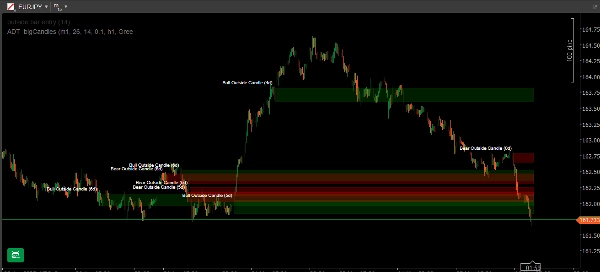
ATR Big Candle Detector mengimbas carta anda untuk lilin terbesar dan paling signifikan dalam tempoh yang ditetapkan oleh pengguna. Menggunakan Julat Benar Purata (ATR) sebagai penapis volatiliti, ia menyerlahkan “lilin besar” ini dengan segi empat berwarna yang berterusan. Setiap zon dilabel dengan jenis corak lilin dan umur, memberikan konteks visual yang jelas untuk pedagang pada semua peringkat.
Ciri-ciri Utama
- Penapisan Berasaskan ATR:
Mengesan hanya lilin yang melebihi ambang ATR yang boleh disesuaikan, menumpukan pada pergerakan yang benar-benar signifikan. - Pengesanan Pelbagai Corak:
-
- Mod Standard: Mencari semua lilin yang memenuhi kriteria ATR.
- Mod Khas: Menapis corak tindakan harga klasik seperti Outside Bars, Engulfing Candles, Doji, Marubozu, Hammer, Shooting Star, Pin Bars, dan Spinning Top (dilabel secara automatik).
- Segi Empat Berterusan:
Menandakan setiap lilin besar dengan segi empat berwarna (bullish atau bearish) yang kekal pada carta untuk rujukan - sesuai untuk memetakan zon bekalan/permintaan dan sokongan/rintangan. - Tetapan Boleh Disesuaikan:
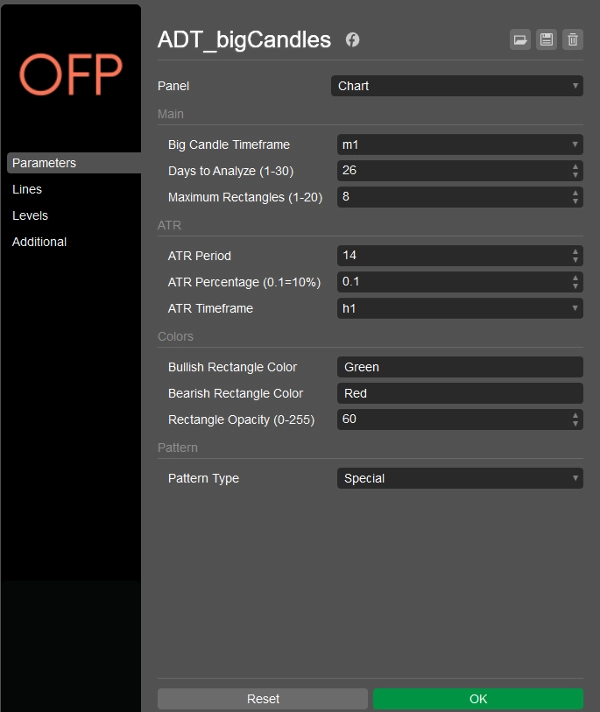
Laraskan jangka masa, hari untuk imbas, tempoh ATR, penampilan segi empat, dan banyak lagi. - Pengurusan Tindih:
Mengelakkan segi empat bertindih jenis yang sama untuk carta yang kemas. - Pelabelan Corak:
Setiap zon dilabel dengan arah, jenis corak, dan hari sejak kejadian.
Cara Ia Berfungsi
- Mengimbas lilin terkini (sehingga 30 hari ke belakang) pada jangka masa pilihan anda.
- Mengira ATR untuk menetapkan ambang julat dinamik.
- Mengesan dan menyusun lilin terbesar mengikut julat.
- Melukis dan melabel segi empat untuk analisis pantas.
Siapa Yang Sesuai?
- Pedagang prop firm dan runcit yang memetakan pergerakan institusi
- Pedagang tindakan harga dan analisis teknikal
- Sesiapa yang mengautomasikan pengenalpastian lilin dan zon berimpak tinggi
Mengenai Pengarang:
Seorang pedagang prop firm profesional di The5%ers dan OFP, dengan pengalaman luas dalam tindakan harga dan perdagangan zon. Penunjuk ini dibangunkan berdasarkan keperluan perdagangan sebenar dan digunakan setiap hari dalam persekitaran perdagangan langsung.
Sesuai untuk pedagang yang ingin mengautomasikan pengesanan zon dan meningkatkan analisis tindakan harga mereka.
Ringkasan
Key features include two detection modes: Standard Mode, which finds all candles exceeding the ATR threshold, and Special Mode, which filters classic price action patterns such as Outside Bars, Engulfing Candles, Doji, Marubozu, Hammer, Shooting Star, Pin Bars, and Spinning Top, with automatic labeling. The indicator prevents overlapping rectangles of the same type for chart clarity and allows customization of timeframe, ATR period, scan duration, and rectangle appearance. Each highlighted zone is labeled with candle direction, pattern type, and age.
This tool is suitable for prop firm and retail traders focused on price action and technical analysis, particularly those automating the identification of high-impact candles and zones for enhanced trading decisions.
Ulasan pelanggan
5 | 100 % | |
4 | 0 % | |
3 | 0 % | |
2 | 0 % | |
1 | 0 % |


