
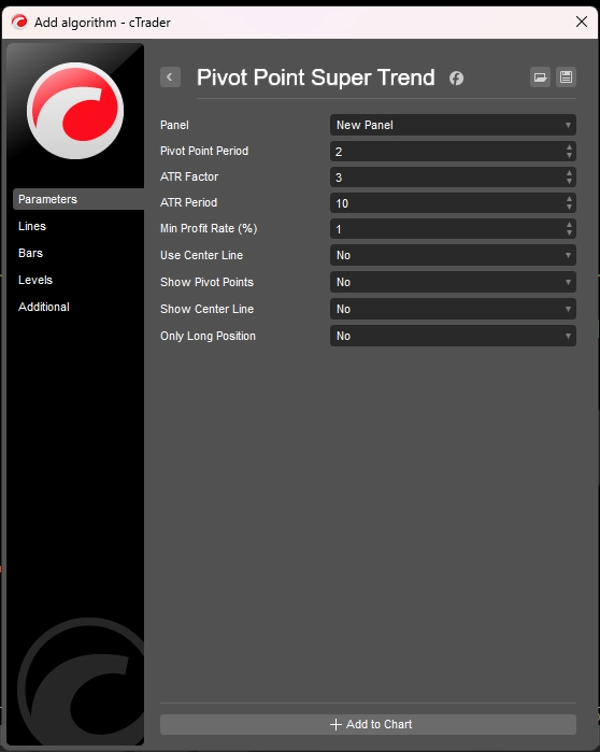
Penerangan
Penat dengan penunjuk yang lambat dan isyarat palsu? Temui gabungan terbaik teori titik pivot dan momentum SuperTrend yang memberikan anda titik masuk dan keluar yang tepat seperti laser dengan ketepatan profesional.
🌟 APA YANG MENJADIKAN PENUNJUK INI ISTIMEWA?
Teknologi Kuasa Berganda
- Ketepatan Titik Pivot: Mengenal pasti tahap sokongan/rintangan utama menggunakan pengesanan titik pivot yang canggih
- Momentum SuperTrend: Menggabungkan volatiliti ATR dengan ketepatan mengikuti tren
- Pengesahan Isyarat Pintar: Menghapuskan isyarat palsu dengan pengesahan tren terbina dalam
Ciri Profesional
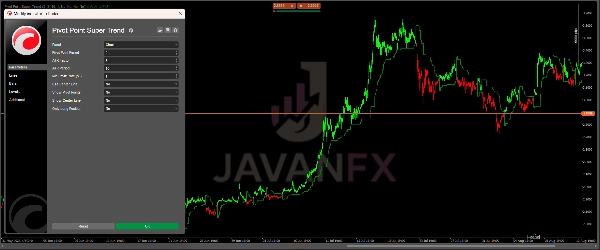
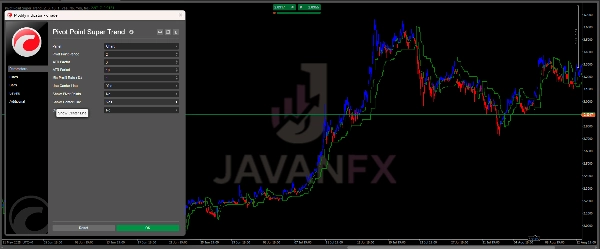
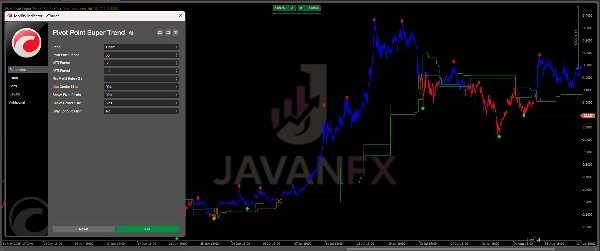
- 🎯 Isyarat Tren Visual: Garis berwarna jelas (Hijau = Bullish, Merah = Bearish)
- ⚡ Amaran Masa Nyata: Pemberitahuan desktop segera untuk peluang masuk
- 📊 Titik Pivot Dinamik: Secara automatik mengesan titik perubahan pasaran yang penting
- 🎚️ Sepenuhnya Boleh Disesuaikan: Laraskan kepekaan untuk padan dengan gaya dagangan atau jangka masa apa pun
📈 SESUAI UNTUK SEMUA PASARAN & JANGKA MASA
Pedagang Harian: Tangkap tren intrahari dengan kemasukan tepat
Pedagang Ayunan: Ikuti tren utama dengan keyakinan
Pedagang Forex & Kripto: Berfungsi dengan sangat baik di pasaran yang tidak stabil
Pedagang Saham & Niaga Hadapan: Boleh dipercayai di semua instrumen cair
🎯 CARA MENGGUNAKAN (Mudah & Berkuasa)
Persediaan Asas:
- Terapkan penunjuk ke carta anda (jangka masa 1min hingga mingguan)
- Garis Hijau: Harga di atas = isyarat BELI 📈
- Garis Merah: Harga di bawah = isyarat JUAL 📉
Isyarat Masuk:
- BELI apabila garis bertukar HIJAU dan harga ditutup di atas
- JUAL apabila garis bertukar MERAH dan harga ditutup di bawah
- Pengesahan: Tunggu penjajaran titik pivot untuk ketepatan lebih tinggi
Strategi Keluar:
- Henti Rugi: Di bawah/atas garis SuperTrend
- Ambil Untung: Apabila garis tren berubah warna atau pada tahap pivot utama
Ciri Lanjutan:
- Garis Pusat: Gunakan sebagai sokongan/rintangan dinamik untuk pengambilan untung separa
- Titik Pivot: Tahap utama bertindak sebagai pengesahan untuk masuk/keluar
⚙️ TETAPAN OPTIMUM
Dagangan Harian (1min - 15min):
- Tempoh Pivot: 2-3
- Faktor ATR: 2.5-3.5
- Tempoh ATR: 10-15
Dagangan Ayunan (1H - Harian):
- Tempoh Pivot: 3-5
- Faktor ATR: 3-4
- Tempoh ATR: 14-20
Dagangan Posisi (Mingguan):
- Tempoh Pivot: 5-7
- Faktor ATR: 4-5
- Tempoh ATR: 20-25
💡 TIP PRO
- Gabungkan dengan sokongan/rintangan utama untuk hasil yang hebat
- Gunakan pada pelbagai jangka masa untuk konfluens (contoh, tren 1H + kemasukan 15min)
- Laraskan Faktor ATR berdasarkan volatiliti pasaran
- Uji semula tetapan berbeza untuk instrumen khusus anda
Ringkasan
Key functionalities include color-coded trend lines—green for bullish and red for bearish trends—real-time desktop alerts for trade opportunities, and dynamic pivot points that automatically detect significant market turning points. It is fully customizable, allowing traders to adjust sensitivity settings to suit various trading styles and timeframes.
This indicator supports all markets and timeframes, making it suitable for day traders, swing traders, forex, crypto, stock, and futures traders. Typical usage involves applying the indicator to charts from 1-minute to weekly intervals, interpreting green lines and price above as buy signals, and red lines with price below as sell signals, with pivot point alignment for confirmation. Exit strategies include setting stop losses relative to the SuperTrend line and taking profits at trend changes or pivot levels.
Optimal settings vary by trading style, with specific pivot periods, ATR factors, and ATR periods recommended for day trading, swing trading, and position trading. Additional features include a center line for dynamic support/resistance and partial profit-taking.
Ulasan pelanggan
5 | 100 % | |
4 | 0 % | |
3 | 0 % | |
2 | 0 % | |
1 | 0 % |


