
Penerangan
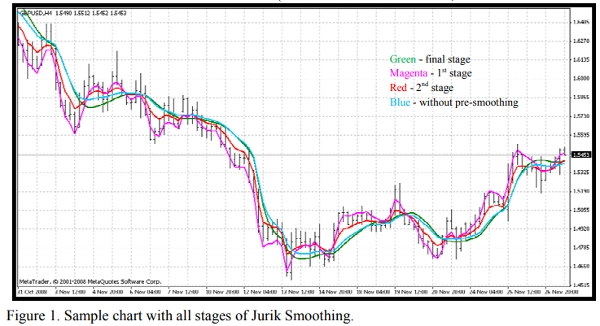
Pelapisan Jurik merangkumi 3 peringkat:
Peringkat 1 - pelapisan awal oleh EMA adaptif: MA1 = (1-alpha)*Price + alpha*MA1[1];
Peringkat 2 - satu lagi pelapisan awal oleh penapis Kalman: Det0 = (Price - MA1)*(1-beta) + beta*Det0[1]; MA2 = MA1 + PR*Det0;
Peringkat 3 - pelapisan akhir oleh penapis adaptif Jurik unik: Det1 = (MA2 - JMA[1]) * (1-alpha)^2 + alpha^2 * Det1[1]; JMA = JMA[1] + Det1;
di mana: - Price - Siri Harga - alpha - faktor dinamik (akan diterangkan di bawah) - beta - nisbah berkala = 0.45*(Length-1)/(0.45*(Length-1)+2) - PR - Nisbah Fasa: PR = Phase/100 + 1.5 (jika Phase < -100 maka PR=0.5, jika Phase > 100 maka PR=2.5).
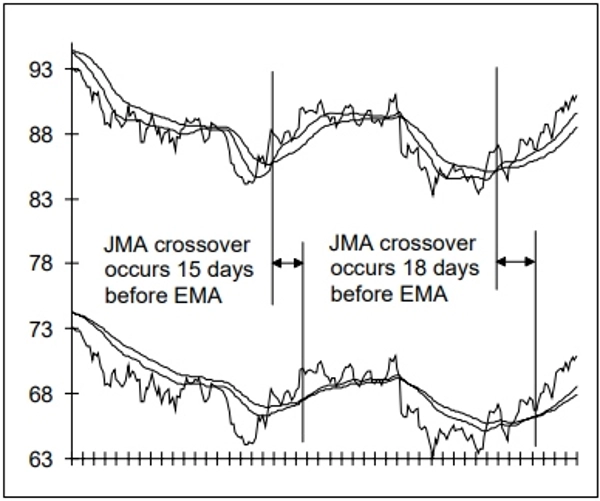
Rajah 1. Carta contoh dengan semua peringkat Pelapisan Jurik. Anda boleh melihat keputusan (Rajah 1) setiap peringkat melalui penunjuk JurikFilter_v2 yang dilampirkan, menukar FilterMode: 0 - peringkat akhir (JMA) 1 - peringkat 1 2 - peringkat 2 3 - hanya pelapisan akhir (tanpa pelapisan awal).
Faktor Dinamik adalah faktor berkala (beta) yang dinaikkan ke kuasa (pow):
alpha = beta ^ Pow,
di mana: - pow = rVolty ^ pow1 - rVolty - volatiliti harga relatif - pow1 - kuasa volatiliti relatif dengan formula berikut: pow1 = len1 - 2 (jika pow1 < 0.5 maka pow1 = 0.5),
di mana len1 - faktor berkala tambahan: len1 = Log(SquareRoot(len))/Log(2.0) + 2 (jika len1 < 0 maka len1 = 0).
Oleh itu anda boleh lihat bahawa Faktor Dinamik berdasarkan volatiliti harga relatif yang memberikan kebolehsuaian yang diperlukan untuk jenis penapis harga ini.
Formula untuk volatiliti harga relatif ialah rVolty = Volty/AvgVolty (jika rVolty > len1^(1/pow1) maka rVolty = len1^(1/pow1), jika rVolty < 1 maka rVolty = 1),
di mana:
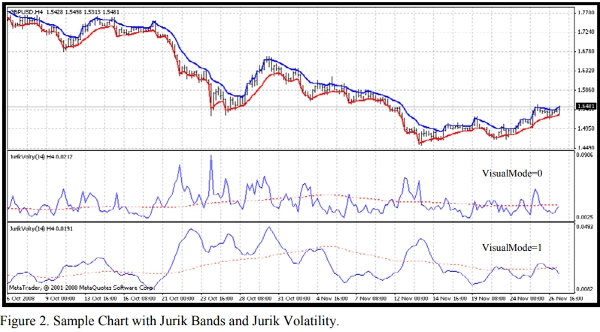
- Volty - volatiliti harga berdasarkan pengiraan apa yang dipanggil Jurik Bands (VisualMode = 1).
- AvgVolty - purata volatiliti yang mana Jurik menggunakan algoritma pengiraan yang agak rumit: AvgVolty = Average(vSum,AvgLen),
di mana:
- vSum - jumlah bertambah (Volty - Volty[10])/10;
- AvgLen - tempoh purata (Jurik menggunakan 65).
Dalam versi saya bagi Penapis Jurik saya menggunakan purata mudah menggantikan purata kompleks Jurik
Selain itu, dengan penunjuk JurikVolty_v1 yang dilampirkan (Rajah 2) anda boleh melihat nilai untuk Volty (VisualMode=0), vSum (VisualMode=1) dan AvgVolty (garis bertitik merah).
Formula untuk volatiliti harga ialah Volty = maksimum antara Abs(del1) dan Abs(del2), jika Abs(del1) = Abs(del2) maka Volty = 0,
di mana: - del1 - jarak antara harga dan jalur atas del1 = Price - UpperBand - del2 - jarak antara harga dan jalur bawah del2 = Price - LowerBand Jalur Jurik berbeza daripada mana-mana jalur harga yang diketahui seperti Bollinger, Keltner, Donchian, Fractal dan sebagainya: jika del1 > 0 maka UpperBand = Price jika tidak UpperBand = Price - Kv*del1 jika del2 < 0 maka LowerBand = Price jika tidak LowerBand = Price - Kv*del2,
di mana: - Kv - faktor volatiliti Kv = bet ^ SquareRoot(pow2). Mudah untuk melihat bahawa jalur ini boleh menjadi asas untuk penunjuk mengikuti tren seperti Parabolic Wilder. Jadi, anda boleh lihat kami hampir tiada tempat samar dalam algoritma Purata Bergerak Jurik (JMA)
Ringkasan
Ulasan pelanggan
5 | 0 % | |
4 | 100 % | |
3 | 0 % | |
2 | 0 % | |
1 | 0 % |


