
Sero
Indikator
105 muat turun
Versi 1.0, Mar 2026
Windows, Mac
Penerangan
Sero — Osilator Momentum
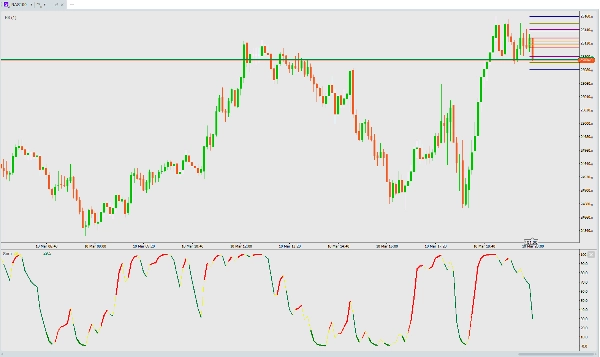
Sero adalah osilator momentum berasaskan stokastik yang memberikan isyarat visual berwarna yang jelas untuk peralihan momentum pasaran.
Bagaimana Ia Berfungsi
Sero mengira nilai stokastik yang dilicinkan dari Harga Tipikal (Tinggi+Rendah+Tutup)/3 dalam julat 15 bar, kemudian menggunakan EMA 2 tempoh yang pantas untuk menghasilkan osilator 0–100 yang responsif.
Apa Yang Perlu Diperhatikan
Warna menceritakan kisah:
- Garis Kuning — nilai asas Sero (sentiasa kelihatan)
- Garis Merah — momentum bullish (Sero meningkat)
- Garis Merah Tebal — momentum bullish kuat (meningkat + di atas 20 — mengesahkan breakout dari kawasan oversold)
- Garis Hijau — momentum bearish (Sero menurun)
- Garis Hijau Tebal — penurunan bearish kuat (menurun + di bawah 20 — sangat dalam kawasan oversold)
Isyarat utama:
- Isyarat beli — Warna bertukar dari Hijau ke Merah, terutamanya dari bawah 20 (pembalikan oversold)
- Isyarat jual — Warna bertukar dari Merah ke Hijau, terutamanya dari atas 80 (pembalikan overbought)
- Trend kuat — Garis tebal mengesahkan keyakinan momentum
- Keletihan — Hijau Tebal di bawah 20 = penjual mungkin kehabisan tenaga, perhatikan pembalikan
Amalan Terbaik
- Berfungsi pada mana-mana jangka masa dan mana-mana instrumen
- Gabungkan dengan tindakan harga atau tahap sokongan/rintangan untuk pengesahan
- Peralihan warna berhampiran ekstrem (0 atau 100) adalah isyarat dengan kebarangkalian tertinggi
- Tiada tetapan diperlukan — dioptimumkan dan sedia untuk digunakan terus
Ringkasan
Ringkasan AI
Sero is a stochastic-based momentum oscillator designed to identify market momentum shifts through clear, color-coded visual signals. It calculates a smoothed stochastic value from the Typical Price [(High + Low + Close) / 3] over a 15-bar range, then applies a fast 2-period exponential moving average (EMA) to generate a responsive oscillator ranging from 0 to 100.
The indicator displays multiple colored lines to represent momentum states:
- Yellow line: base Sero value (always visible)
- Red line: bullish momentum (rising oscillator)
- Thick red line: strong bullish momentum (rising and above 20, indicating breakout from oversold)
- Green line: bearish momentum (falling oscillator)
- Thick green line: strong bearish momentum (falling and below 20, indicating deep oversold conditions)
Key signals include buy signals when the color flips from green to red, especially below 20 (oversold reversal), and sell signals when it flips from red to green, especially above 80 (overbought reversal). Thick lines confirm strong momentum trends, while thick green lines below 20 may indicate exhaustion of selling pressure and potential reversal.
Sero works on any timeframe and instrument without requiring user settings, and it is recommended to combine it with price action or support/resistance levels for confirmation. Color transitions near extremes (0 or 100) provide the highest-probability signals.
Profil indikator
Ulasan pelanggan
0.0
Ulasan: 0
Ulasan pelanggan
Belum ada ulasan untuk produk ini. Anda sudah mencuba produk tersebut? Jadilah yang pertama untuk berkongsi pendapat anda!
Perbincangan
Soalan Lazim
BTCUSD
Forex
Signal
Indices
EURUSD
Commodities
GBPUSD
NZDUSD
Crypto
Stocks
XAUUSD
NAS100
USDJPY
Produk yang tersedia melalui cTrader Store, termasuk bot dagangan, indikator dan plugin, disediakan oleh pembangun pihak ketiga dan diberikan akses untuk tujuan maklumat dan teknikal sahaja. cTrader Store bukan broker dan tidak memberikan nasihat pelaburan, syor peribadi atau sebarang jaminan prestasi masa hadapan.
Lebih banyak produk daripada penulis ini


![Logo "[CB] Pivot Points Pro"](https://cdn.ctrader.com/image/webp/43463c82-67b0-4f10-a4ba-901bba091d81_32594)


Harga
Sejak 10/03/2026
105
Pemasangan percuma