
Penerangan
Indeks Kebolehdagangan Pelbagai Rangka Masa
The Indeks Kebolehdagangan Pelbagai Rangka Masa adalah penganalisis keadaan pasaran lanjutan yang mengenal pasti bila pasaran secara statistik menguntungkan untuk berdagang. Daripada menjana isyarat beli atau jual, ia mengukur sejauh mana keadaan pasaran semasa boleh didagangkan merentasi pelbagai rangka masa, membolehkan anda memberi tumpuan hanya pada tempoh di mana tindakan harga adalah bersih, berarah, dan mampu menghasilkan pergerakan bermakna.
Tidak seperti penunjuk tradisional yang bergantung pada ambang tetap, penunjuk ini sentiasa menyesuaikan diri dengan setiap rangka masa dengan membandingkan tingkah laku pasaran semasa dengan garis asas sejarahnya sendiri. Pendekatan kalibrasi sendiri ini membolehkannya berfungsi merentasi Forex, indeks, komoditi, mata wang kripto, dan pasaran CFD lain tanpa memerlukan pengoptimuman manual.
Bagaimana Ia Berfungsi
Penunjuk menilai enam ciri bebas pasaran pada setiap rangka masa.
Trend berbanding kebetulan menggunakan Indeks Kebosanan Pasaran.
Kelembutan berbanding kekasaran menggunakan Dimensi Fraktal.
Nisbah isyarat kepada bunyi untuk menentukan sama ada ayunan bermakna menguasai turun naik rawak.
Kebersihan trend dengan mengukur sejauh mana harga bergerak dengan cekap dan bukannya sentiasa berbalik.
Kekerapan peluang dagangan dengan mengira kaki ayunan yang signifikan.
Kemajuan arah bersih untuk menentukan sama ada harga membuat kemajuan bermakna dan bukannya berulang kali mundur.
Setiap faktor dinormalisasi berbanding dengan tingkah laku sejarahnya sendiri menggunakan analisis skor z statistik. Ini bermakna penunjuk menilai sama ada keadaan semasa luar biasa menguntungkan dan bukannya hanya di atas atau di bawah ambang sewenang-wenangnya.
Faktor yang dinormalisasi digabungkan menjadi skor berwajaran dari 0 hingga 100.
Penunjuk ini juga termasuk penapis kos transaksi yang menghalang rangka masa pendek daripada menerima skor tinggi apabila ayunan harga purata terlalu kecil untuk mengatasi spread dan komisen secara realistik.
Papan Pemuka
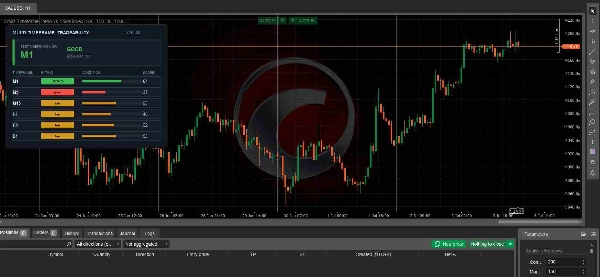
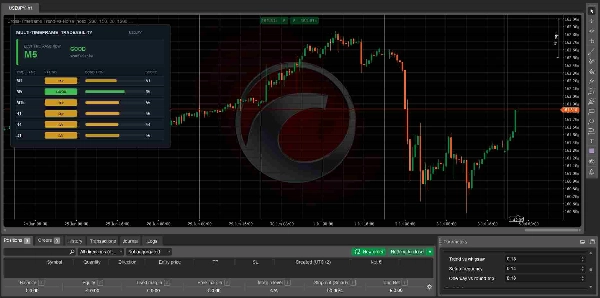
Papan pemuka menganalisis enam rangka masa secara serentak.
M1
M5
M15
H1
H4
D1
Setiap rangka masa menerima salah satu daripada tiga penarafan.
BAIK menunjukkan keadaan pasaran yang sangat menguntungkan.
SEDERHANA menunjukkan keadaan yang boleh diterima tetapi kurang ideal.
BURUK menunjukkan bahawa struktur pasaran pada masa ini tidak menguntungkan.
Penunjuk secara automatik menyerlahkan rangka masa dengan skor tertinggi bersama dengan Skor Kebolehdagangan semasanya.
Mentafsir Skor
80 hingga 100 menunjukkan keadaan dagangan yang luar biasa dengan pergerakan berarah yang kuat dan bunyi pasaran yang rendah.
60 hingga 79 menunjukkan keadaan yang sangat baik di mana strategi dagangan mungkin berprestasi baik.
40 hingga 59 menunjukkan keadaan purata di mana pemilihan disyorkan.
Di bawah 40 menunjukkan struktur pasaran yang buruk dengan kebetulan berlebihan, kekasaran, atau pergerakan yang tidak mencukupi.
Skor yang lebih tinggi tidak meramalkan arah pasaran. Ia hanya menunjukkan bahawa arah mana pun yang berkembang secara statistik lebih cenderung menghasilkan tindakan harga yang lebih bersih dan lebih boleh didagangkan.
Parameter Utama
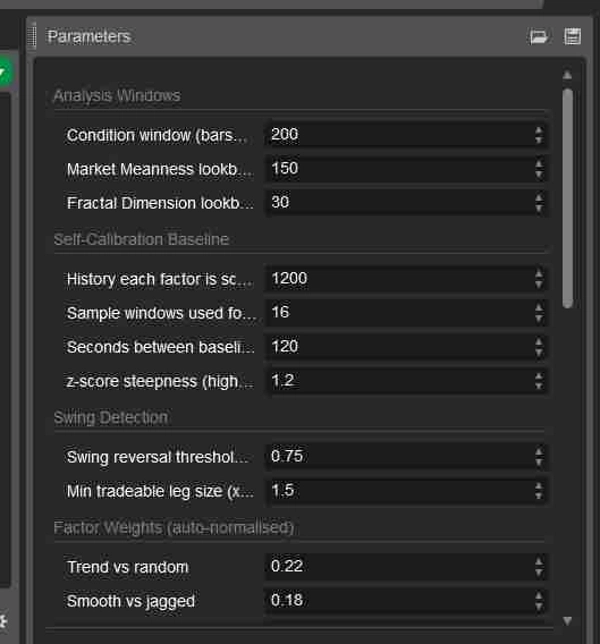
Tetingkap Analisis mengawal berapa banyak sejarah pasaran digunakan untuk mengira setiap faktor.
Garis Asas Kalibrasi Sendiri menentukan bagaimana penormalan sejarah dilakukan.
Pengesanan Ayunan melaraskan kepekaan yang digunakan untuk mengenal pasti ayunan harga yang signifikan.
Berat Faktor membolehkan pengguna lanjutan menekankan atau mengurangkan kepentingan setiap ciri pasaran.
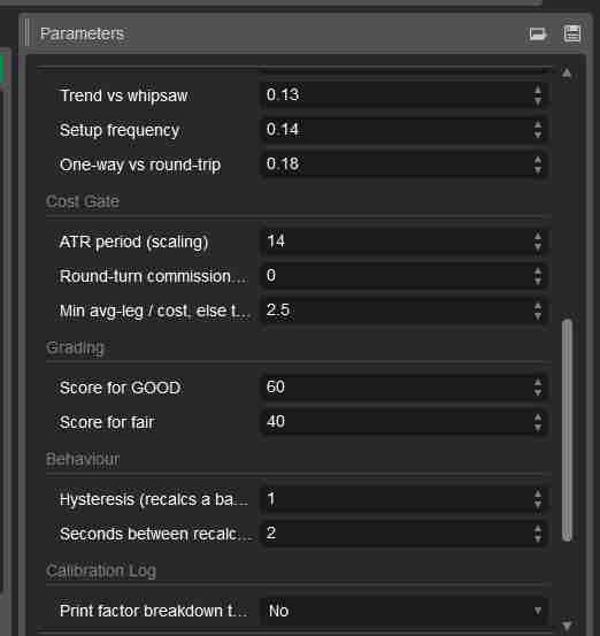
Pintu Kos mengawal sejauh mana kos transaksi mempengaruhi penarafan akhir secara agresif.
Tetapan penggredan menentukan ambang skor untuk klasifikasi BAIK dan SEDERHANA.
Tetapan papan pemuka membenarkan kawalan penuh ke atas saiz panel dan kedudukan skrin.
Kes Penggunaan Terbaik
Mencari rangka masa yang paling boleh didagangkan sebelum mencari kemasukan.
Mengelakkan keadaan pasaran yang mendatar, bising, atau berkualiti rendah.
Menapis isyarat daripada strategi dagangan sedia ada.
Meningkatkan dagangan budi bicara dengan memberi tumpuan hanya pada persekitaran yang secara statistik menguntungkan.
Menyokong sistem algoritma dengan penapis keadaan pasaran yang adaptif.
Siapa Ia Untuk
Penunjuk ini sesuai untuk pemula yang mahukan panduan objektif tentang bila keadaan pasaran menguntungkan, serta pedagang budi bicara dan algoritma berpengalaman yang mencari penapis kualiti pasaran adaptif yang berfungsi merentasi pelbagai instrumen dan rangka masa.
Nota Penting
Penunjuk ini bukan penjana isyarat beli atau jual.
Ia tidak meramalkan arah harga masa depan.
Ia hanya mengukur kualiti keadaan pasaran semasa.
Untuk hasil terbaik, gabungkan dengan strategi kemasukan, keluar, dan pengurusan risiko sedia ada anda. Dagangan dengan kebarangkalian tertinggi biasanya berlaku apabila tetapan dagangan anda sendiri selari dengan rangka masa yang menerima penarafan Kebolehdagangan BAIK.
Ringkasan
The indicator provides a weighted Tradeability Score from 0 to 100 for six timeframes (M1, M5, M15, H1, H4, D1), classifying each as GOOD, FAIR, or POOR based on current market quality. It includes a transaction cost filter to account for realistic trading conditions on shorter timeframes. The dashboard highlights the highest scoring timeframe and its score, helping traders focus on periods with clean, directional price action suitable for trading.
This tool does not generate buy or sell signals nor predict price direction; instead, it serves as a market quality filter to improve discretionary or algorithmic trading by signaling when conditions are statistically favorable. Key parameters allow customization of analysis windows, swing detection sensitivity, factor weights, and grading thresholds. It is suitable for traders seeking objective guidance on market structure and tradeability across multiple instruments and timeframes.