

EMA MTF TREND
Indikator
2 käufe
Version 1.0, Feb 2026
Windows, Mac
4.0
Bewertungen: 1
Trading product for EMA MTF TREND Indikator BTCUSD Prop, image 2
Trading product for EMA MTF TREND Indikator BTCUSD Prop, image 3
Trading product for EMA MTF TREND Indikator BTCUSD Prop, image 4
Trading product for EMA MTF TREND Indikator BTCUSD Prop, image 5
24
Verkäufe
662
Kostenlose Installationen

Beschreibung

Überblick

Hören Sie auf, die Marktrichtung zu erraten. EMA MTF Cloud & Dashboard ist ein umfassendes Trendfolge-Toolkit, das für Scalper und Daytrader entwickelt wurde. Es kombiniert die Glätte der Exponentiellen Gleitenden Durchschnitte mit der Kraft der Multi-Timeframe-Analyse, alles in einer sauberen Chart-Oberfläche.

Im Gegensatz zu Standardindikatoren enthält dieses Tool eine Smart Neutral Zone-Logik, um unruhige Märkte herauszufiltern und Sie vor falschen Signalen während Seitwärtsphasen zu schützen.

Hauptmerkmale

Dynamische EMA-Wolken
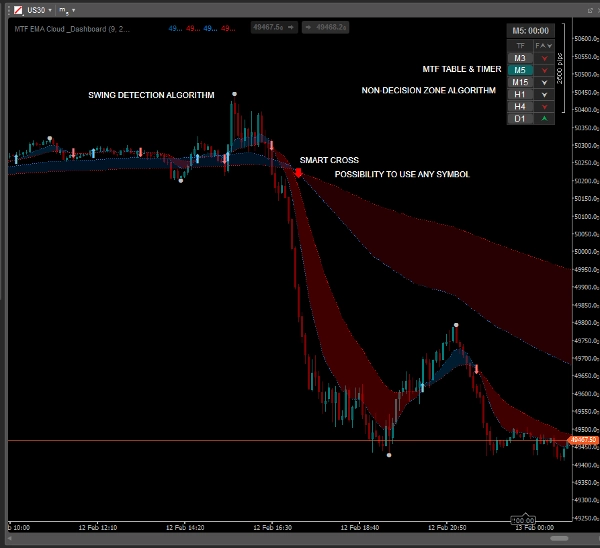
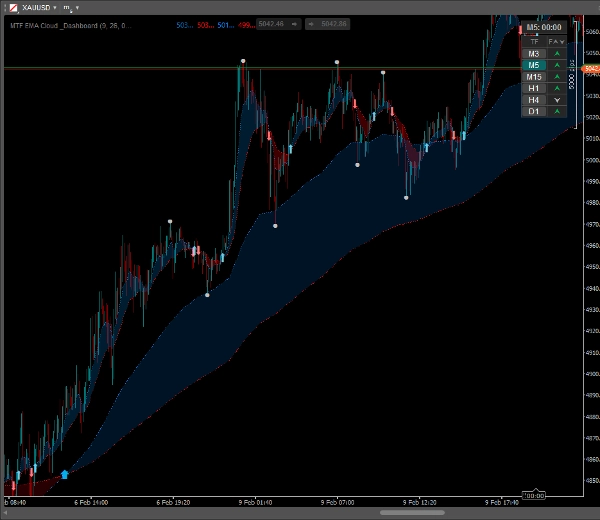
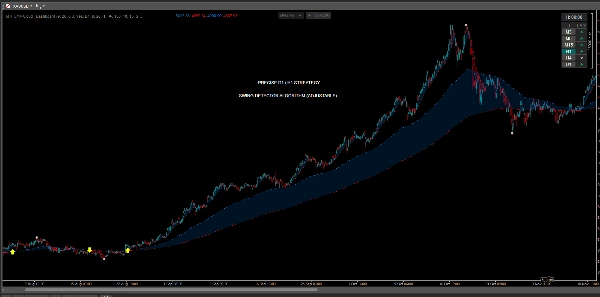
Visualisieren Sie den Trend sofort. Der Raum zwischen schnellen und langsamen EMAs wird mit einer halbtransparenten Wolke gefüllt, was es einfach macht, die Trendstärke und potenzielle Unterstützungs-/Widerstandsbereiche zu erkennen.

MTF Overlay (Multi-Timeframe)
Sehen Sie das "große Ganze", ohne die Charts zu wechseln. Zeigen Sie EMAs höherer Zeitrahmen (z. B. H1) direkt in Ihrem Chart mit niedrigerem Zeitrahmen (z. B. M5) an.

  • Enthält separate Kreuzungspfeile für den MTF-Trend!

Smart Trend Dashboard
Eine kompakte, anklickbare Tabelle, die den Trendstatus für 6 Zeitrahmen (M3 bis täglich) anzeigt.

  • Neutral Zone Logik: Das Dashboard erkennt Seitwärtsmärkte (Konsolidierung) und markiert sie grau/silbern, um Ihnen zu helfen, schlechte Trades zu vermeiden.
  • Interaktiv: Klicken Sie auf eine beliebige Zeitrahmen-Schaltfläche in der Tabelle, um sofort den Chart zu wechseln.

Swing High / Swing Low Punkte
Markiert automatisch bedeutende lokale Hochs und Tiefs. Perfekt zum Platzieren von Stop Loss-Orders oder zum Identifizieren von Take Profit-Niveaus basierend auf der jüngsten Preisstruktur.

Visuelle Kreuzungssignale
Klare, anpassbare Pfeile erscheinen genau dann, wenn der schnelle EMA den langsamen EMA kreuzt.

  • Passen Sie Farben, Größen und Pfeilstile an.

Kerzen-Timer
Ein integrierter Countdown-Timer zeigt genau an, wie viel Zeit bis zum Kerzenschluss verbleibt, was für das Timing Ihrer Einstiege unerlässlich ist.

Wie man handelt (Strategiebeispiel)

  1. Dashboard prüfen: Stellen Sie sicher, dass höhere Zeitrahmen (z. B. H1, H4) übereinstimmen (Grün/Rot). Vermeiden Sie das Trading, wenn sie "Neutral" (Grau) anzeigen.
  2. Auf das Signal warten: Achten Sie auf einen Kreuzungspfeil in Richtung des Haupttrends.
  3. Mit Price Action bestätigen: Verwenden Sie die "Swing High/Low"-Punkte, um die Marktstruktur zu bestätigen.
  4. Einstieg & Verwaltung: Einstieg beim Kerzenschluss. Verwenden Sie die EMA-Wolke als dynamische Unterstützung, um Ihren Stop Loss nachzuziehen.

Anpassung

Der Indikator ist hochgradig anpassbar, um Ihrem Stil zu entsprechen:

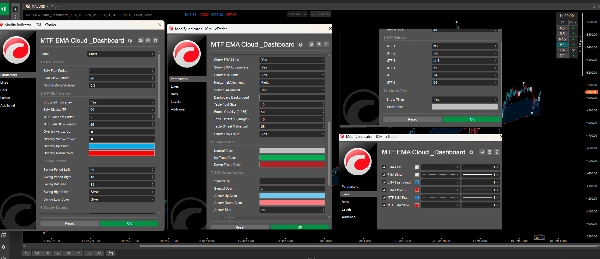
  • Passen Sie die EMA-Perioden für den aktuellen und MTF-Modus an.
  • Ändern Sie die Farben für Wolken, Pfeile, Swings und das Dashboard.
  • Konfigurieren Sie die Position und Transparenz des Dashboards.
  • Schalten Sie jede Funktion unabhängig ein oder aus.

Zusammenfassung

KI-Zusammenfassung
EMA MTF TREND is a trading indicator designed for scalpers and day traders to analyze market trends using Exponential Moving Averages (EMA) combined with Multi-Timeframe (MTF) analysis. It features dynamic EMA clouds that visually represent trend strength and potential support/resistance zones by shading the area between fast and slow EMAs. The indicator overlays higher timeframe EMAs onto lower timeframe charts, allowing users to view broader market trends without switching charts.
A smart dashboard displays trend status across six timeframes (from 3 minutes to daily), incorporating a neutral zone logic that highlights flat or consolidating markets to help avoid false signals. The dashboard is interactive, enabling quick chart switching by clicking on timeframe buttons. The tool automatically marks swing high and low points to assist in setting stop loss and take profit levels based on recent price structure. Visual crossover arrows signal EMA fast and slow line crossovers, with customizable colors and styles. Additionally, a candle timer shows the remaining time until the current candle closes, aiding precise trade timing.
The indicator is highly customizable, allowing adjustments to EMA periods, colors, dashboard position, transparency, and feature toggling to fit individual trading styles. It supports markets including Forex, Crypto, and commodities like gold (XAUUSD), and is tagged for use with symbols such as BTCUSD and USDJPY.
Indikatorprofil

Kundenbewertungen

4.0
Bewertungen: 1
5
0 %
4
100 %
3
0 %
2
0 %
1
0 %
Kundenbewertungen
March 1, 2026
It becomes more useful when the setup needs a cleaner reason to exist. It can look better than it is during a lucky run.

Diskussion

Häufig gestellte Fragen (FAQ)

BTCUSD
Prop
Forex
Scalping
Supertrend
Crypto
AI
XAUUSD
USDJPY
Über den cTrader Store verfügbare Produkte, einschließlich Handelsbots, Indikatoren und Plugins, werden von externen Entwicklern bereitgestellt und nur zu Informations- und technischen Zugriffszwecken verfügbar gemacht. cTrader Store ist kein Broker und erbringt keine Anlageberatung, persönlichen Empfehlungen oder eine Garantie für zukünftige Performance.

Mehr von diesem Autor

Indikator
AI
Prop
+8
The EMA Trend Simple is a trend-following tool designed for simplicity and visual clarity.
cBot
Prop Firm Fit
Stop Loss (SL) Manager
+1
HTS Strategy Tester - Advanced Multi-Timeframe Trend & Pullback Trading System H1/m1 & H4/m5 WWS 33/144 Start from 100$
90.1%
Rendite
2.92
Gewinnfaktor
Indikator
AI
Grid
+7
Follow The Trend cBot - INDICATOR - displays two Moving Average Bands for cBot or for your own use
Indikator
AI
SMC
+7
The ultimate tool for Price Action and ICT. High, Low and Mid levels for days, weeks Inc. NY Midnight and Custom Range.
Indikator
ATR
Prop
+13
HCCC MTF (Hurst Cycle Composite Channel), Designed for Semi-Automated Trading, Interactive MTF Dashboard
Indikator
ATR
MACD
+15
MACD Advanced -- It combines the standard MACD logic with a rich set of visual tools
Indikator
AI
RSI
+7
EMA MTF TREND PRO - Multi-timeframe trend analysis overlay indicator, 6 timeframes - in one table with ADX
Indikator
ATR
Channel
+1
Bollinger Bands Advanced Squeeze & Breakout System, Real-Time On-Chart Dashboard, Auto-Squeeze Detector, Dual-Band Cloud
Indikator
AI
SMC
+4
Weekly Daily Opening Gaps — NWOG & NDOG Indicator Professional-grade opening gap visualization for institutional traders
Indikator
SMC
Prop
+11
Sessions PRO is a professional session visualization indicator - 4 Fully Customizable Sessions
Indikator
AI
ATR
+12
The standard Relative Strength Index (RSI), RSI & Signal Cloud, Smart Volatility Filter (ATR), On-Chart Info Dashboard
cBot
ATR
EMA
+5
FOLLOW THE TREND XAU EDITION v3.0, Start with $500, AI features BE & TP50%, cbot management simplified
36.2%
Rendite
5.09
Gewinnfaktor

Das könnte Sie auch noch interessieren

Indikator
ATR
Forex
+7
Final Moving Average is an adaptive system designed to keep traders aligned with the true direction of the market
Indikator
Spread Filter
SpreadSync Entry Timer is a compact cTrader indicator that shows live spread and candle-close.
Indikator
Overlay HTF context on any chart: color bars by HTF and draw filled HTF bodies with optional High/Low lines.
Indikator
Customizable window inside your platform, access to any website Calendar
Indikator
SMC
Prop
+6
Automatically draws the Opening Range (High & Low) for Tokyo, London, and New York sessions. Configurable start times,
Indikator
MSS
Key Levels
+4
Maps session ranges, previous highs/lows, equilibrium and premium/discount zones on your cTrader chart.
Indikator
Plots intraday VWAP and dynamic ±1/±2 standard deviation (SD) bands based on current day’s price and volume.
Indikator
SMC
Prop
+13
Killzone Session With VWAP – Precision Meets Price Action
Indikator
ATR
A lightweight Multi Time Frame bias dashboard for quickly spotting market direction across multiple timeframes.
Indikator
MultiTF Pivot and SR Indicator
Indikator
Signal
Supertrend
Supertrend Scanner – Track trends across assets & timeframes in real-time with alerts. Stay ahead, and trade smarter!
Indikator
BOS
MSS
+3
Maps BOS, CHoCH, swing breaks and market structure shifts directly on your cTrader chart.
Indikator
BOS
CHOCH
+2
The full SMC suite: structure BOS CHoCH MSS , FVG, liquidity, order blocks & a 0 to100 confluence score. No repaint.
Indikator
RSI
MACD
+1
Precision Supply & Demand zones indicator—automatically plots key buy/sell areas on your chart for smarter entries.
Indikator
Forex
cTrader ZigZag Alerts: Precision Swing Detection, Alerts, and Fibonacci.
Indikator
News Filter
External Data
+3
Real-time financial news and economic calendar overlay for cTrader with smart alerts
Indikator
Forex
Crypto
+3
MARainbow gives you the edge with four customizable moving averages—each color-coded for instant recognition.
Indikator
ATR
RSI
+3
🚀 Specialized algorithm is designed to confirm entry and exit points with precision 🎯

Preis

24
Verkäufe
662
Kostenlose Installationen




























