
Penerangan
Profil Isipadu Sesi HD
Apa Yang Dilakukannya
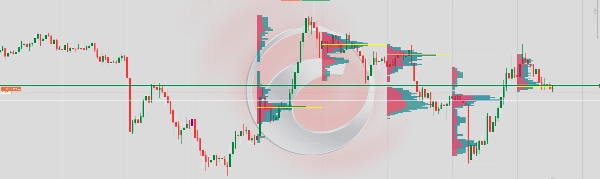
Memaparkan profil isipadu mendatar untuk setiap sesi dagangan terus pada carta. Ia menunjukkan bagaimana isipadu dagangan diedarkan merentasi tahap harga, membantu pedagang mengenal pasti zon aktiviti tinggi, kawasan nilai adil, dan tahap sokongan/rintangan utama yang diperoleh semata-mata daripada tingkah laku isipadu.
Bagaimana Ia Berfungsi
Pada setiap penutupan bar baru, penunjuk mengimbas semua bar dalam bilangan sesi yang ditetapkan dan mengagihkan isipadu tik setiap bar merentasi julat harganya. Isipadu dibahagikan kepada bahagian beli (bar menaik) dan bahagian jual (bar menurun) menggunakan arah buka/tutup bar sebagai proksi. Keputusan dipaparkan sebagai histogram mendatar berlapis yang berlabuh pada sempadan masa sesi.
Elemen Visual
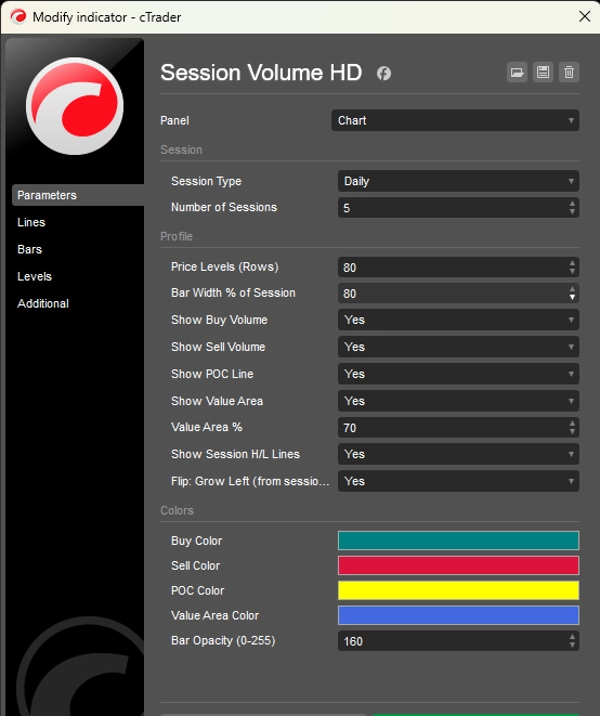
Bar Beli (Hijau Laut) — Menunjukkan isipadu yang didagangkan pada pergerakan harga menaik di setiap tahap. Membesar ke kiri (atau ke kanan jika diterbalikkan) dari sauh sesi.
Bar Jual (Merah) — Menunjukkan isipadu yang didagangkan pada pergerakan harga menurun di setiap tahap, disusun bersebelahan bar beli.
Garis POC (Kuning) — Titik Kawalan. Garis mendatar yang menandakan tahap harga dengan jumlah isipadu tertinggi dalam sesi. Bertindak sebagai magnet untuk harga.
Kawasan Nilai (Lapisan Biru) — Julat harga yang mengandungi peratusan boleh laras (lalai 70%) daripada jumlah isipadu sesi. Mewakili zon "nilai adil" di mana kebanyakan dagangan berlaku.
Garis H/L Sesi (Putih bertitik) — Menandakan harga tertinggi dan terendah yang dicapai sepanjang sesi.
Prestasi
Penunjuk melukis semula hanya sekali setiap bar baru, bukan pada setiap tik. Ini menghapuskan berkelip dan memastikan rendering stabil walaupun dengan banyak sesi dan bilangan tahap harga yang tinggi.
Had
Oleh kerana cTrader tidak mendedahkan isipadu bida/tanya sebenar pada tahap bar tanpa suapan data tik, isipadu beli/jual dianggarkan menggunakan arah bar: bar menaik diberi berat 65% beli / 35% jual, bar menurun sebaliknya, dan bar doji dibahagikan 50/50. Untuk isipadu delta sebenar, langganan data tik diperlukan.


