
Smart Money Map - JR
Indikator
1 pembelian
Versi 2.0, May 2026
Windows, Mac
4.0
Ulasan: 2
Penerangan
Penunjuk lapisan lanjutan untuk menyerlahkan konteks pelaksanaan utama dan membantu menyelaraskan struktur, lokasi, dan risiko dalam satu aliran kerja yang dipermudahkan.
➤ Ciri Utama
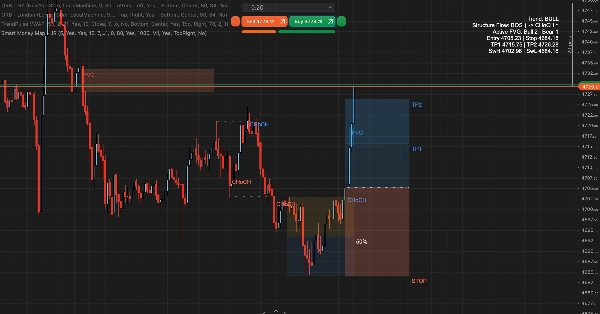
- Pelabelan acara struktur dengan kepekaan boleh laras dan mod pengesahan
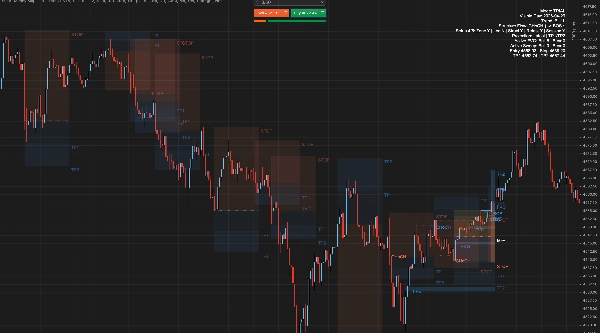
- Pemetaan jurang nilai adil aktif dengan saiz dan penapisan sesi boleh laras
- Pengesanan sapuan kecairan untuk konteks awal (skor sahaja, mod minimum)
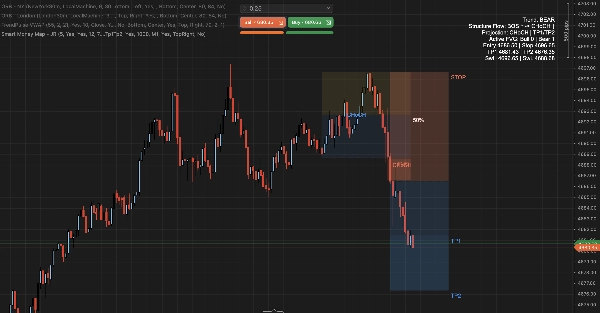
- Julat urus niaga premium/diskaun dengan keseimbangan 50%
- Kotak unjuran masuk/henti/sasaran dinamik
- Visualisasi sasaran fleksibel: sasaran tunggal, pecahan TP1/TP2, atau sasaran berasaskan struktur
- Kebolehlihatan label unjuran pilihan dan had henti maksima untuk kawalan intrahari yang lebih ketat
- Saluran output sedia automasi untuk aliran kerja cBot
- Penempatan papan pemuka fleksibel untuk carta berbilang penunjuk
- Praset ketumpatan dengan pelarasan masa automatik pilihan
➤ Cara Ia Berfungsi
- Mengesahkan ayunan struktur dan mengesan peralihan arah serta keadaan sambungan.
- Mengesan sapuan kecairan melebihi tahap ayunan terlindung.
- Memetakan zon ketidakseimbangan aktif dan mengemas kini apabila harga berinteraksi dengan struktur.
- Membingkai lokasi pasaran semasa dengan konteks premium/diskaun.
- Meramalkan peta risiko dari keadaan struktur semasa.
- Menerbitkan output acara deterministik untuk automasi.
➤ Sesuai Untuk
- Carta SMC intrahari dan perancangan pelaksanaan
- Pedagang yang mahukan struktur visual dan konteks POI tanpa kekacauan berat
- Set up berbilang penunjuk yang memerlukan penempatan papan pemuka boleh laras
➤ Cara Menggunakan
- Baca struktur terlebih dahulu menggunakan penunjuk trend papan pemuka.
- Gunakan konteks lokasi untuk mengenal pasti zon premium dan diskaun.
- Gunakan zon ketidakseimbangan aktif dan konteks sapuan pilihan untuk memperhalusi masa.
- Gunakan peta unjuran sebagai rujukan perancangan dagangan.
➤ Kawalan Termasuk
- Kepekaan struktur dan mod pengesahan
- Saiz ketidakseimbangan, penapisan sesi, dan tingkah laku paparan mitigasi
- Pilihan julat urus niaga dan paparan unjuran
- Kawalan unjuran termasuk mod sasaran, mod sauh, kebolehlihatan label, dan had henti pilihan
- Mod ketumpatan: Tersuai, M1, M5, M15, H1, H4, D1
- Pelarasan ketumpatan automatik pilihan berdasarkan jangka masa carta
- Penyesuaian warna untuk keterbacaan carta
Ringkasan
Ringkasan AI
Smart Money Map - JR is an advanced overlay indicator designed for intraday trading to visually highlight key market execution contexts by integrating structure, location, and risk into a streamlined workflow. It identifies and labels structural events with configurable sensitivity and confirmation modes, detects liquidity sweeps beyond swing levels, and maps active fair value gaps with adjustable sizing and session filters. The indicator frames market price zones into premium and discount ranges centered around a 50% equilibrium level.
It features dynamic projection boxes for entry, stop, and target levels, supporting flexible target visualization options including single targets, split take-profits, or structure-derived targets. Users can control projection label visibility and apply maximum stop caps for tighter intraday risk management. The tool supports automation through deterministic event outputs compatible with cBot workflows and allows customizable dashboard placement for multi-indicator chart setups. Density presets with optional automatic timeframe adjustment enhance adaptability across different chart resolutions.
The indicator operates by confirming structural swings, tracking directional shifts, detecting liquidity sweeps, updating imbalance zones as price interacts with structure, and projecting a risk map based on current market conditions. It is suited for traders seeking clear visual structure and points of interest without chart clutter, particularly those focused on Smart Money Concepts (SMC) and market structure analysis.
Profil indikator
Kategori indikator
Struktur pasaran (SMC)
Jenis output
Visualisasi
Keperluan data
Bar sahaja
Isyarat yang disokong
Kekuatan trend
Pecahan paras
Sentuhan paras
Ulasan pelanggan
4.0
Ulasan: 2
5 | 0 % | |
4 | 100 % | |
3 | 0 % | |
2 | 0 % | |
1 | 0 % |
Perbincangan
Soalan Lazim
Premium/Discount
MSS
BOS
CHOCH
Market Structure
Produk yang tersedia melalui cTrader Store, termasuk bot dagangan, indikator dan plugin, disediakan oleh pembangun pihak ketiga dan diberikan akses untuk tujuan maklumat dan teknikal sahaja. cTrader Store bukan broker dan tidak memberikan nasihat pelaburan, syor peribadi atau sebarang jaminan prestasi masa hadapan.


![Logo "[Hamster-Coder] Pivot Points MTF"](https://cdn.ctrader.com/image/webp/4c143e5a-309c-40e3-a578-f04d1e133ffa_31159)


Harga
Sejak 11/02/2026
14
Jualan
77
Pemasangan percuma