Descrizione
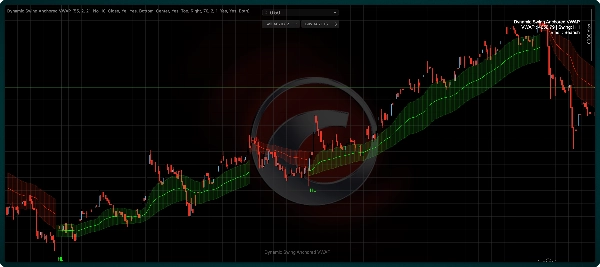
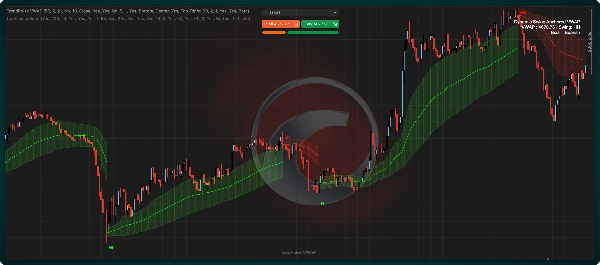
TrendPulse VWAP è un indicatore VWAP consapevole della struttura che si riancora automaticamente ai pivot swing confermati invece di utilizzare un reset di sessione fisso.
È progettato per i trader che desiderano una visione più adattiva della struttura dei prezzi, del flusso direzionale e delle zone di valore. L'indicatore traccia i massimi e minimi swing confermati, determina il bias strutturale attivo e ricostruisce il VWAP dai pivot significativi in modo che la linea rimanga allineata al contesto di mercato.
A differenza di un VWAP di sessione tradizionale, questo strumento segue la struttura di mercato. Può evidenziare cambiamenti rialzisti e ribassisti, mostrare bande di deviazione opzionali, etichettare i pivot e mostrare una dashboard compatta con il trend attuale e l'ultimo stato swing.
➤ Caratteristiche principali
- VWAP dinamico ancorato agli swing con politica di ancoraggio configurabile
- Conferma pivot configurabile per la validazione swing solo dal lato destro
- Etichettatura dello stato swing per il contesto visivo della struttura
- Controlli opzionali per politiche di ancoraggio più rigorose
- Filtri di qualità dell'ancora per un riancoraggio controllato
- Smussamento adattivo con bande opzionali sensibili alla volatilità
- Gestione del volume tick con limitazione degli spike
- Controlli di rendering per storici lunghi
- Dashboard compatta con posizionamento flessibile
- Output pronti per l'automazione per flussi di lavoro cBot
➤ Come funziona
- Conferma i massimi e minimi swing utilizzando il lookback e le barre di conferma configurate.
- Deriva la direzione della struttura attiva dai pivot confermati più recenti.
- Classifica il contesto dell'ultimo pivot per riferimento visivo.
- Riancora il VWAP quando sono soddisfatte le regole di accettazione dell'ancora.
- Aggiorna lo stato VWAP ancorato barra per barra quando non viene accettata una nuova ancora.
- Costruisce bande opzionali da misure di volatilità configurate.
➤ Ideale per
- Trader intraday e swing che desiderano un contesto VWAP consapevole della struttura
- Trader che vogliono un contesto di trend adattivo con comportamento di riancoraggio controllato
➤ Come usarlo
- Leggi la struttura dall'indicatore di trend della dashboard e dalle etichette swing.
- Regola la sensibilità usando le barre di conferma e i controlli di qualità dell'ancora.
- Usa VWAP e bande opzionali per il contesto di posizione rispetto alla struttura attuale.
➤ Controlli inclusi
- Sensibilità swing e impostazioni di conferma
- Smussamento adattivo e controlli di bias di volatilità
- Controlli di qualità dell'ancora e politica di reset
- Modello di banda e controlli di distanza della banda
- Controlli visivi per etichette, sfondo del trend e orizzonte di rendering
- Personalizzazione dei colori per la leggibilità del grafico
Riepilogo
Key features include configurable pivot confirmation and anchor quality filters, swing-state labeling for visual structure context, optional volatility-based deviation bands, adaptive smoothing, tick-volume handling with spike capping, and a compact dashboard displaying current trend and last swing state. The indicator supports automation-ready outputs for integration with cBot workflows.
TrendPulse VWAP is suited for intraday and swing traders seeking a dynamic VWAP that adapts to market structure changes with controlled re-anchoring behavior. Users can adjust sensitivity and anchor policies to tailor the indicator’s responsiveness and use the VWAP line and bands to assess price location relative to the evolving trend and confirmed pivots.
Recensioni dei clienti
5 | 100 % | |
4 | 0 % | |
3 | 0 % | |
2 | 0 % | |
1 | 0 % |