present
Registrati e ricevi uno sconto da $50 sul tuo primo acquisto
Trading product for Supply n Demand Indicatore Volume Supply & Demand, image 1
Supply n Demand
Indicatore
125 download
Versione 1.0, Jul 2026
Windows, Mac
5.0
Recensioni: 1
Trading product for Supply n Demand Indicatore Volume Supply & Demand, image 2
Trading product for Supply n Demand Indicatore Volume Supply & Demand, image 3
Da 11/02/2026
14
Vendite
245
Installazioni gratuite

Descrizione

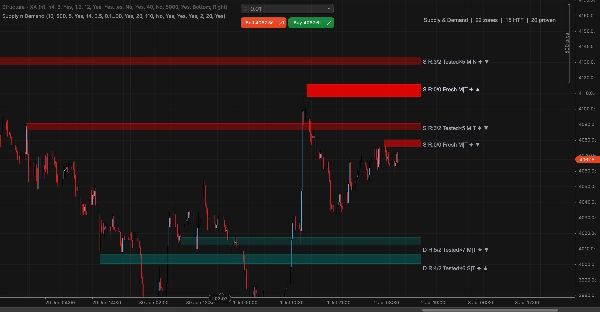
Rilevamento delle zone di Offerta e Domanda dai pivot swing, con congiunzione multi-timeframe e filtro volume. Le zone si proiettano 20 barre in avanti e tracciano ogni retest e breakout - l'opacità della zona svanisce con l'età, le zone confluente MTF ricevono un bordo solido, e il ribaltamento di ruolo inverte le zone rotte al lato opposto.

Ogni zona ha un'etichetta compatta con tutti i segnali di qualità: tipo S/D, conteggi di retest/breakout, freschezza (Fresh/Tested×N), esplosività (Forte/Moderata/Debole), compattezza della base (Stretta/Normale/Larga), congiunzione HTF (✦), e volume alla formazione (▲/▼). Le zone Fresh + ✦ + ▲ sono di massima qualità - intatte, confermate dalla struttura H4, e formate su volume elevato.


CARATTERISTICHE

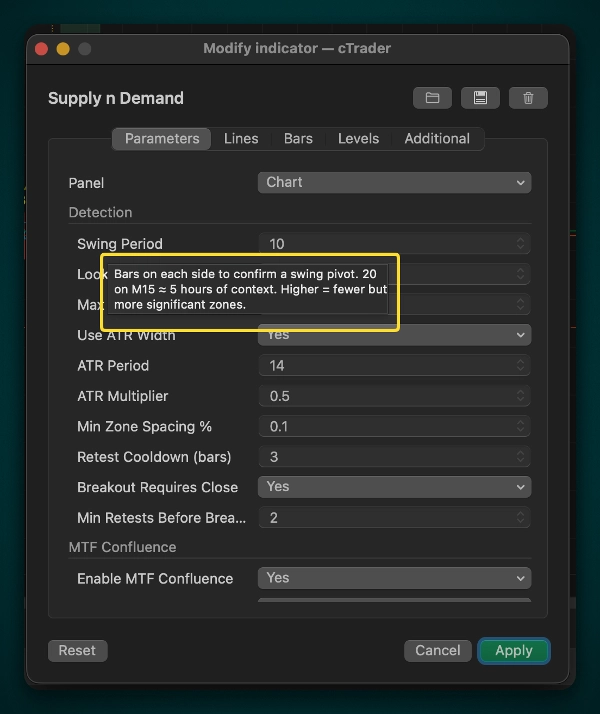
• Rilevamento pivot swing con periodo configurabile (default 20 su M15)
• Cancello rigido HTF H4 — vengono create solo le zone che si sovrappongono alla struttura H4 (opzionale)
• Protezione multi-touch — le zone devono superare N retest prima che il breakout venga conteggiato
• Filtro volume — le zone formate con volume tick superiore alla media ricevono il tag ▲
• Ribaltamento zona / inversione di ruolo — l'Offerta rotta diventa Domanda (e viceversa)
• Dissolvenza visiva — l'opacità diminuisce con i tocchi; la percentuale di dissolvenza globale controlla la trasparenza
• Bordi di confine TrendLine — ritagliati all'estensione della zona, più forti per le zone HTF
• Dashboard compatto — conteggio zone, conteggio HTF, conteggio zone provate in alto a destra
• Conservazione delle zone provate — le zone con 3+ tocchi non scadono mai


GRUPPI DI PARAMETRI

Rilevamento — Periodo Swing, moltiplicatore/dimensione ATR, regole breakout, cooldown retest
Congiunzione MTF — riferimento H4, attivazione cancello rigido HTF, swing/lookback HTF
Congiunzione Volume — media mobile volume, soglia %, soppressione basso volume
Stile — colori, spessore bordo, visibilità etichetta
Visivo — percentuale dissolvenza globale, attivazione dashboard


FLUSSO DI LAVORO TRADING

1. Identificare zone di alta qualità: Fresh, ✦, ▲, base Stretta
2. Attendere che il prezzo raggiunga la zona — NON entrare solo al tocco
3. Attendere conferma della candela (engulfing, pin bar, martello alla Domanda; shooting star, engulfing all'Offerta)
4. Stop loss oltre il confine della zona + buffer; TP alla zona opposta successiva
5. Per i ribaltamenti: attendere il retest DOPO il breakout, poi la candela di conferma


IMPOSTAZIONI CONSIGLIATE

• Scalping (M1-M5): Swing=8, ATR=1.0, HTF=H1, RequireHTF=false
• Intraday (M15-M30): Swing=20, ATR=1.5, HTF=H4, RequireHTF=true (default)
• Swing (H1-D1): Swing=20, ATR=2.0, HTF=D1/W1, RequireHTF=true


➤ LETTURA DELL'ETICHETTA

Ogni zona ha un'etichetta al suo bordo destro con informazioni di qualità compresse. Esempio: S R:3/2 Tested×5 M|N ✦ ▼

Spiegazione

  • S / D - Offerta (resistenza) o Domanda (supporto)
  • R:3/2 - Retest:3 / Breakout:2 — la zona ha tenuto 3 volte, è stata rotta 2 volte
  • Tested×5 - Tocchi totali (retest + breakout = 5) — indicatore di freschezza
  • M|N - Esplosività|Base: M=Moderata, N=larghezza base Normale
  • ✦ - Congiunzione HTF confermata — la zona si sovrappone a una zona H4 dello stesso tipo
  • ▼ / ▲ - Volume alla formazione: ▲=sopra la media (forte), ▼=sotto la media (più debole)

Come leggere le zone a colpo d'occhio

  • Fresh + ✦ + ▲ — qualità più alta: intatta, confermata da timeframe superiore, formata su volume elevato
  • Tested×5-7 — la zona è stata testata più volte, la probabilità che tenga diminuisce ad ogni tocco
  • Più una zona è trasparente (sbiadita) — minore è il volume di formazione o più tocchi ha ricevuto. L'alpha visivo mostra immediatamente quali zone sono "consumate"


Questo indicatore è solo per analisi. Non esegue operazioni. Testare sempre su un conto demo prima di operare in reale.

Riepilogo

Riepilogo AI
Supply n Demand is a technical indicator designed to detect supply and demand zones based on swing pivots, incorporating multi-timeframe (H4) confluence and volume filtering. It projects zones 20 bars forward, tracking each retest and breakout, with zone opacity fading as zones age. Zones confirmed by higher timeframe structure have solid borders, and broken zones flip roles from supply to demand or vice versa.

Each zone features a compact label displaying key quality signals: zone type (Supply or Demand), retest and breakout counts, freshness, explosiveness, base tightness, higher timeframe confluence, and volume at formation. Zones formed on above-average tick volume and confirmed by H4 structure are marked as highest quality.

Key features include configurable swing pivot detection, optional H4 hard gate filtering, multi-touch protection requiring zones to survive multiple retests before breakout recognition, volume-based filtering, visual fading of zones with age or touches, and preservation of proven zones with three or more touches. A compact dashboard shows zone counts and quality metrics.

Parameters cover detection settings, multi-timeframe and volume confluence, visual style, and dashboard options. Recommended settings vary by trading style, from scalping to swing trading. The indicator provides visual support and resistance levels with detailed quality metrics for analysis but does not execute trades.
Profilo indicatore
Categoria indicatore
Supporto e resistenza
Tipo di output
Visualizzazione
Requisiti per i dati
Solo barre
Volume
Segnali supportati
Livello raggiunto
Livello rotto

Recensioni dei clienti

5.0
Recensioni: 1
5
100 %
4
0 %
3
0 %
2
0 %
1
0 %
Recensioni dei clienti
July 23, 2026
Pack with all the info I need - retests, breakouts, volume, HTF- all in one. Great work!

Discussioni

Domande frequenti

Volume
Supply & Demand
I prodotti disponibili tramite cTrader Store, inclusi bot di trading, indicatori e plugin, sono forniti da sviluppatori terzi e resi disponibili esclusivamente a scopo informativo e di accesso tecnico. cTrader Store non è un broker e non fornisce consulenze in materia di investimento, raccomandazioni individualizzate o garanzie di risultati futuri.

Altro da questo autore

Indicatore
ATR
Key Levels
+1
Builds active 4H range as a zone, watches for a sweep beyond its High or Low, and signals when price closes back inside.
Plugin per desktop
Prop
Forex
+4
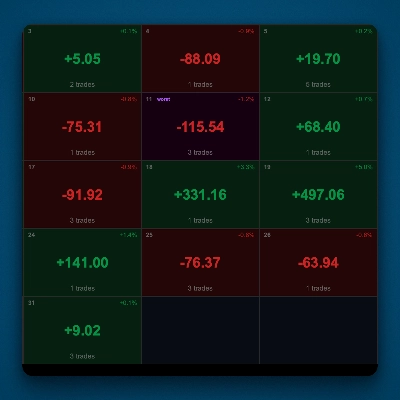
Visual monthly trading journal that displays your performance day-by-day in a calendar view.
Indicatore
ATR
VWAP
+4
Structure-aware indicator that re-anchors VWAP to confirmed swing pivots.
Indicatore
BOS
MSS
+3
Advanced indicator to highlight key execution context and help aligning structure, location, and risk.
Indicatore
EMA
VWAP
+2
ORB Range Indicator maps the opening range and gives a practical session-breakout workflow with clear labels.

Potrebbe interessarti anche

Indicatore
EMA
AI-assisted
+1
Multi EMA Timeframes lets you stay on your chart and see the exact EMA from any timeframe you choose — up to 5 at once.
Indicatore
Liquidity Grab
Liquidity Sweep
+1
CRT Sweep Tracker is an advanced panel for Candle Range Theory (CRT) traders to track HTF sweeps and manage live trades.
Indicatore
BOS
EMA
+5
Directional volume heatmap: see if a price zone was built on buying or selling, not just how much.
Indicatore
AI
SMC
+11
Perfect Entry Price designed to help traders identify the most accurate and reliable price levels for market entries
Indicatore
Master RSI reversals with Parabolic SAR precision! Get real-time alerts for high-probability trend changes.
Indicatore
Prop
Forex
+11
Auto-draws filled trendline zones and detects breakouts with alerts.
Indicatore
Forex
BTCUSD
+10
MultiTimeframe MA
Indicatore
ATR
Forex
+5
🚀 Buy and sell signals 📈📉 only when three independent engines agree simultaneously.
Indicatore
SMC
Forex
+13
MultiFrameCandles para cTrader: La Herramienta Definitiva para Dominar Cualquier Marco de Tiempo
Indicatore
ATR
RSI
+6
🔍 MultiScalpScorePRO – Powerful real-time scoring system combining indicators for ultra-precise scalping signals.
Indicatore
Volume
Channel
+5
Spots volatility squeezes before they fire — the compression phase everyone else misses.
Indicatore
ATR
RSI
+5
Delta RSI Candle Pro, the indicator that transforms ordinary candlesticks into powerful momentum visualizers.
Indicatore
Signal
Supertrend
Supertrend Scanner – Track trends across assets & timeframes in real-time with alerts. Stay ahead, and trade smarter!
Indicatore
Volume
Fibonacci
+3
Draw and manage multiple fixed-range volume profiles with persistent levels, developing POC/VA and smart alerts.
Indicatore
Prop
Forex
+13
Volume Meter
Indicatore
Prop
Forex
+14
Smart money liquidity sweep detector at fractal levels. 100% free - no limitations.
Indicatore
Key Levels
Order Block
+2
It monitors trend lines on price charts and fires multi-channel alerts and optionally places trades when price crosses..
Indicatore
ATR
RSI
+5
Visual indicator for identifying momentum reversals. Designed for forex (1h) and stocks (weekly).

Prezzo

Da 11/02/2026
14
Vendite
245
Installazioni gratuite