
Stochastic Momentum Index
อินดิเคเตอร์
1 การซื้อ
เวอร์ชัน 2.1, Jan 2026
Windows, Mac
4.5
รีวิว: 2
คำอธิบาย
Stochastic Momentum Index (SMI) คือสโตรแคสติกออสซิลเลเตอร์ที่ปรับปรุงให้วัดโมเมนตัมได้อย่างราบรื่นมากกว่าสโตรแคสติกแบบคลาสสิก การใช้งานใน cTrader นี้ตรงกับสูตรที่ใช้กันทั่วไปใน TradingView โดยใช้ การทำให้เรียบด้วย EMA สองชั้น ทั้งในช่วงสัมพัทธ์และช่วงสูง–ต่ำ เพื่อสร้างเส้นโค้งโมเมนตัมที่สะอาดและมั่นคง ซึ่งทำงานได้ดีทั้งในสภาวะแนวโน้มและช่วงขอบเขต
สิ่งที่แสดง
- SMI วัดตำแหน่งราคาปิดเมื่อเทียบกับจุดกึ่งกลางของช่วงสูง–ต่ำล่าสุด โดยทำให้เป็นมาตรฐานและปรับขนาดแล้ว
- ค่ามักจะแกว่งอยู่ระหว่าง -100 ถึง +100.
- ระดับอ้างอิงซื้อมาก/ขายมาก (ค่าเริ่มต้น +40 / -40) ช่วยระบุสภาวะที่ราคายืดตัวและโมเมนตัมสุดขีด
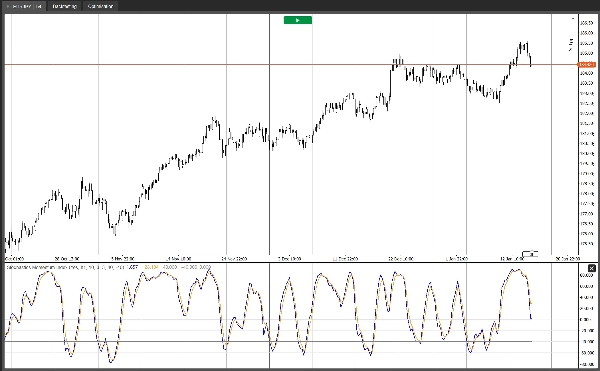
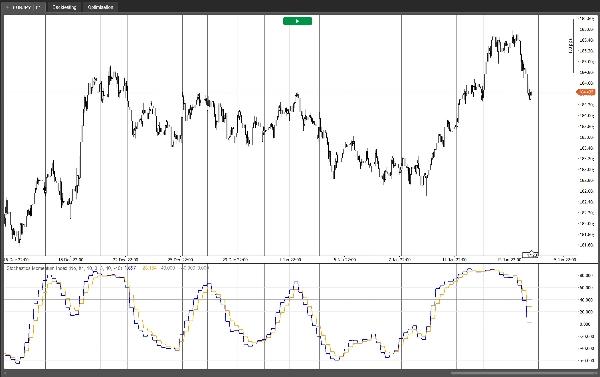
กราฟ
- SMI: เส้นโมเมนตัมหลัก
- EMA ที่อิงจาก SMI: เส้นสัญญาณ (EMA ของ SMI) สำหรับการตัดกันและยืนยัน
- ระดับซื้อมาก / ขายมาก / กลาง (0) สำหรับบริบทภาพรวดเร็ว
วิธีที่เทรดเดอร์ใช้
- สภาวะแนวโน้ม: ใช้ เส้น 0 เป็นตัวกรองทิศทาง (เหนือ 0 = แรงกดดันขาขึ้น, ต่ำกว่า 0 = แรงกดดันขาลง) และเทรดการดีดตัวผ่าน การตัดกันของ SMI กับเส้นสัญญาณ ตามทิศทางแนวโน้ม
- สภาวะฟื้นตัวเฉลี่ย: ลดความรุนแรงเมื่อ SMI กลับจากซื้อมาก/ขายมาก และยืนยันด้วยการตัดกัน โดยมักตั้งเป้าที่ เส้น 0 เป็นเป้าหมายฟื้นตัวเฉลี่ยแรก
- ความแตกต่าง: ความแตกต่างของโมเมนตัมระหว่างราคาและ SMI สามารถชี้ให้เห็นการแกว่งที่อ่อนแรงลงได้
ตัวเลือกหลายกรอบเวลา
- เลือก กรอบเวลาต้นทาง เพื่อคำนวณ SMI จากกรอบเวลาที่สูงกว่าในขณะที่แสดงบนกราฟปัจจุบัน (เหมาะสำหรับกรองสัญญาณรบกวนและปรับปรุงคุณภาพสัญญาณ)
- หรือเปิดใช้งาน ใช้กรอบเวลากราฟ เพื่อคงการคำนวณในกรอบเวลาปัจจุบัน
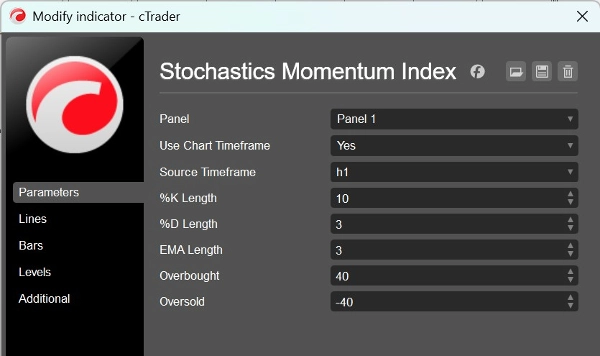
อินพุต
- ความยาว %K: หน้าต่างย้อนหลังสำหรับค่าสูงสุดสูง / ต่ำสุดต่ำ
- ความยาว %D: ความยาวการทำให้เรียบที่ใช้ในคำนวณ double-EMA
- ความยาว EMA: ความยาวเส้นสัญญาณ (EMA ของ SMI)
- ซื้อมาก / ขายมาก: ระดับอ้างอิง
- ใช้กรอบเวลากราฟ / กรอบเวลาต้นทาง: ตัวเลือกการคำนวณกรอบเวลาที่สูงกว่า
อินดิเคเตอร์นี้ถูกสร้างขึ้นให้มีน้ำหนักเบา มีเสถียรภาพ และใช้งานได้จริงสำหรับกระบวนการเทรดจริง—ไม่ว่าคุณจะเทรดการต่อเนื่องของแนวโน้มหรือช่วงขอบเขต หรือใช้ SMI เป็นตัวกรองยืนยันภายในกลยุทธ์ที่กว้างขึ้น
สรุป
สรุปโดย AI
The Stochastic Momentum Index (SMI) indicator for cTrader is a refined momentum oscillator that applies double EMA smoothing to both the relative range and high–low range, producing a smooth and stable momentum curve. It measures the position of the close price relative to the midpoint of the recent high–low range, with values oscillating between -100 and +100. Default overbought and oversold levels are set at +40 and -40, respectively, to highlight momentum extremes.
The indicator plots three key elements: the main SMI momentum line, an EMA-based signal line for crossovers and confirmation, and reference levels for overbought, oversold, and the zero midpoint. Traders use the zero line as a directional filter to identify bullish or bearish pressure and trade pullbacks via SMI and signal line crossovers. It also supports mean-reversion strategies by signaling fades from overbought/oversold conditions and can highlight momentum divergences.
A multi-timeframe option allows calculation of the SMI from a higher timeframe while displaying it on the current chart, helping to filter noise and improve signal quality. User inputs include lookback lengths for %K and %D, signal line EMA length, overbought/oversold levels, and timeframe selection. The indicator is designed for use across various markets including Forex, stocks, commodities, indices, and cryptocurrencies.
โปรไฟล์อินดิเคเตอร์
รีวิวจากลูกค้า
4.5
รีวิว: 2
5 | 50 % | |
4 | 50 % | |
3 | 0 % | |
2 | 0 % | |
1 | 0 % |
รีวิวจากลูกค้า
January 28, 2026
The part worth keeping is the workflow feels calmer, and 2 swing checks is the line to watch.
January 23, 2026
it earns a spot because weak entries have a harder time slipping through, and spread and slippage need a line in the notes.
การสนทนา
คำถามที่พบบ่อย
BTCUSD
Forex
Signal
Breakout
Indices
EURUSD
Commodities
GBPUSD
NZDUSD
Prop
Scalping
Crypto
Stocks
XAUUSD
NAS100
USDJPY
ผลิตภัณฑ์ที่มีให้บริการผ่าน cTrader Store รวมถึงบอทการเทรด อินดิเคเตอร์ และปลั๊กอิน มีให้บริการโดยนักพัฒนาบุคคลที่สามและมีไว้เพื่อวัตถุประสงค์ในการเข้าถึงข้อมูลและทางเทคนิคเท่านั้น cTrader Store ไม่ใช่โบรกเกอร์และไม่ได้ให้คำแนะนำการลงทุน คำแนะนำส่วนบุคคล หรือการรับประกันผลการดำเนินงานในอนาคต
เพิ่มเติมจากผู้เขียนคนนี้


ราคา
ตั้งแต่ 31/01/2025
415.05M
ปริมาณการเทรด
2.69M
Pips ที่ได้กำไร
4
การขาย
187
ติดตั้งฟรี