
JMA-Like
Indicatore
1 acquisti
Versione 1.0, Aug 2025
Windows, Mac
5.0
Recensioni: 1
Descrizione
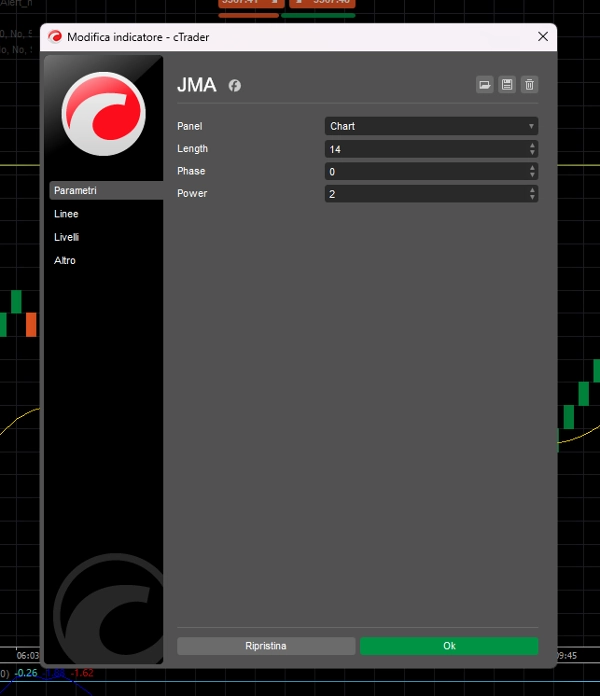
JMA-Like – Media Mobile Adattiva a Ritardo Zero
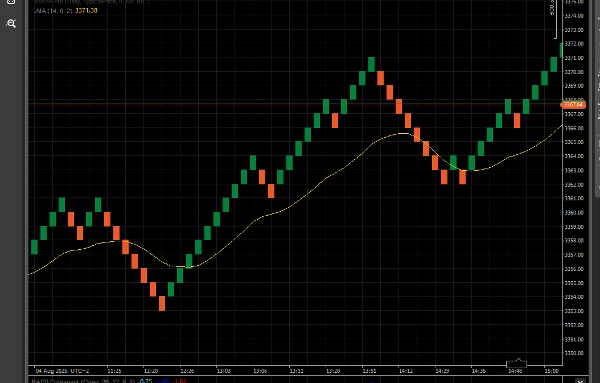
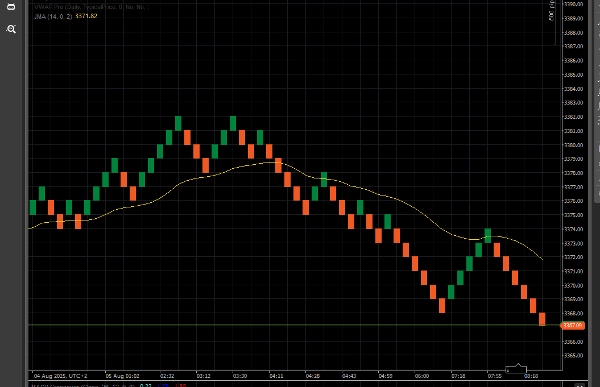
JMA Advanced è una media mobile altamente reattiva e ultra liscia progettata per replicare il comportamento della Jurik Moving Average (JMA) originale. Si adatta dinamicamente alla volatilità del mercato, riducendo il ritardo mentre filtra il rumore.
Costruita con algoritmi di levigatura avanzati, JMA Advanced è perfetta sia per strategie di trend-following che contrarian. Include parametri regolabili Phase e Power per controllare la reattività e l’overshoot, rendendola ideale per trader Renko, a range e price action.
✅ Sensazione di ritardo zero
✅ Adattiva alla volatilità
✅ Funziona su tutti i timeframe e tipi di grafico
✅ Completamente personalizzabile
Riepilogo
Riepilogo AI
JMA-Like is an adaptive zero-lag moving average indicator designed to replicate the behavior of the original Jurik Moving Average (JMA). It features advanced smoothing algorithms that dynamically adjust to market volatility, reducing lag while filtering out noise. The indicator includes customizable Phase and Power parameters, allowing users to control responsiveness and overshoot. It is suitable for various trading styles, including trend-following and contrarian strategies, and works effectively on all timeframes and chart types such as Renko, range, and price action charts. Key features include a zero-lag feel, volatility adaptation, and full customization options.
Profilo indicatore
Recensioni dei clienti
5.0
Recensioni: 1
5 | 100 % | |
4 | 0 % | |
3 | 0 % | |
2 | 0 % | |
1 | 0 % |
Recensioni dei clienti
Discussioni
Domande frequenti
I prodotti disponibili tramite cTrader Store, inclusi bot di trading, indicatori e plugin, sono forniti da sviluppatori terzi e resi disponibili esclusivamente a scopo informativo e di accesso tecnico. cTrader Store non è un broker e non fornisce consulenze in materia di investimento, raccomandazioni individualizzate o garanzie di risultati futuri.
Altro da questo autore


![Logo di "[Stellar Strategies] Inside Bar with Signals"](https://cdn.ctrader.com/image/webp/1d9e8bfa-3b2c-4440-bb37-5856902008a7_30683)


Prezzo
Da 16/07/2025
5
Vendite