
Daily SD Levels - Indicator
Indicatore
4 acquisti
Versione 1.0, Aug 2025
Windows, Mac
5.0
Recensioni: 1
Descrizione
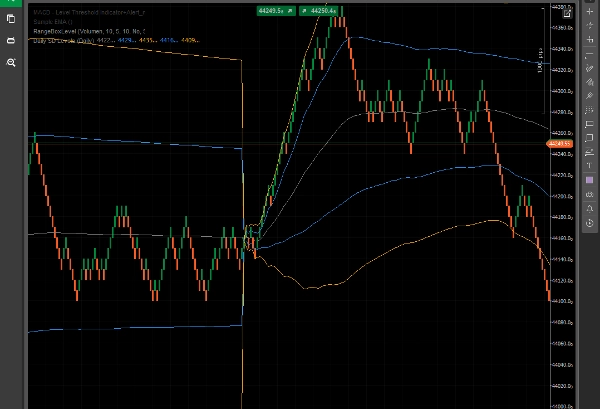
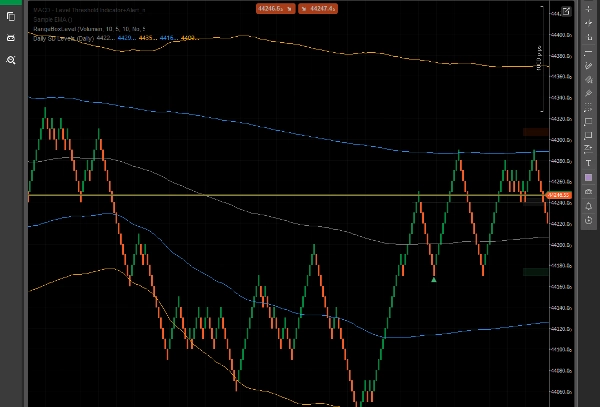
Livelli SD Giornalieri – Bande di Deviazione Standard Dinamiche Basate su VWAP
L'indicatore Livelli SD Giornalieri traccia dinamicamente VWAP (Prezzo Medio Ponderato per il Volume) e Bande di Deviazione Standard (+1/+2 e -1/-2) calcolate sulla giornata di trading corrente.
Questo strumento aiuta i trader a valutare visivamente la volatilità intraday, potenziali zone di supporto/resistenza e estremi di prezzo, tutto basato sul volume reale di mercato e sull’azione del prezzo – non su livelli fissi o arbitrari.
Caratteristiche Principali:
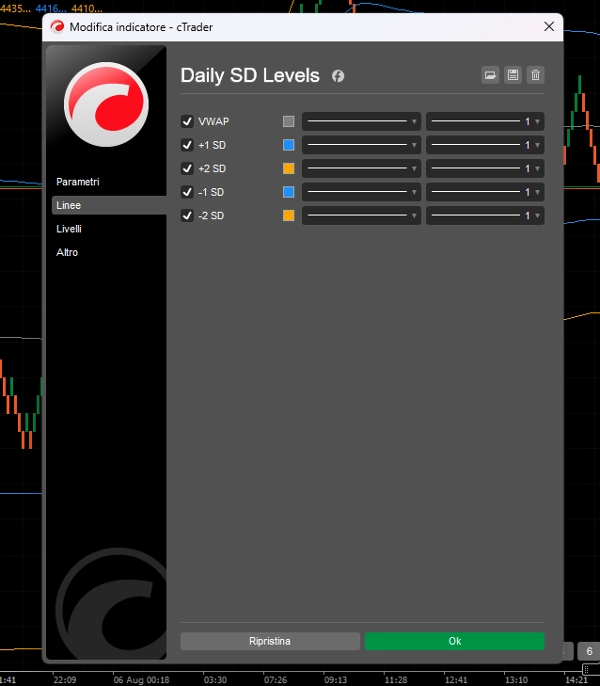
- Linea VWAP per il monitoraggio del valore equo intraday.
- Bande SD +1/+2 e -1/-2 per identificare zone di ipercomprato/ipervenduto.
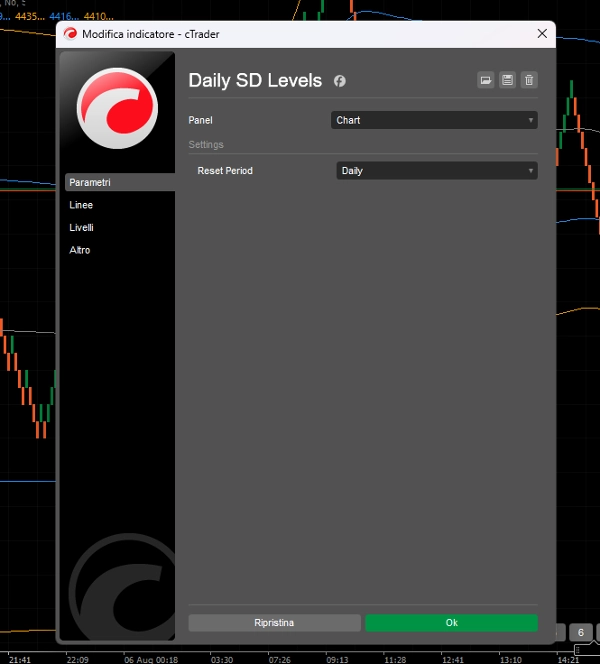
- I livelli si resettano giornalmente, adattandosi alla dinamica di prezzo e volume di ogni sessione.
- Ottimizzato per Renko, Range Bar e Trading Intraday.
- Progettato per trader che necessitano di chiarezza e zone di prezzo dinamiche.
Questo indicatore è perfetto per:
- Setup di rientro alla media.
- Identificare movimenti eccessivi per possibili inversioni.
- Conferma visiva di breakout oltre i confini statistici.
Niente confusione. Solo livelli puliti e reattivi che si muovono con il mercato.
Riepilogo
Profilo indicatore
Recensioni dei clienti
5.0
Recensioni: 1
5 | 100 % | |
4 | 0 % | |
3 | 0 % | |
2 | 0 % | |
1 | 0 % |
Recensioni dei clienti
August 8, 2025
it gives context without making the decision, but the chart still needs a human read.
Discussioni
Domande frequenti
I prodotti disponibili tramite cTrader Store, inclusi bot di trading, indicatori e plugin, sono forniti da sviluppatori terzi e resi disponibili esclusivamente a scopo informativo e di accesso tecnico. cTrader Store non è un broker e non fornisce consulenze in materia di investimento, raccomandazioni individualizzate o garanzie di risultati futuri.


![Logo di "[Hamster-Coder] Moving Average MTF"](https://cdn.ctrader.com/image/webp/b11b98b1-194d-4b8e-b00e-d611826ad159_31226)

Prezzo
Da 16/07/2025
5
Vendite