
FVG & Imbalance Detector
Indicatore
2 acquisti
Versione 1.0, Jan 2026
Windows, Mac
4.0
Recensioni: 2
Descrizione
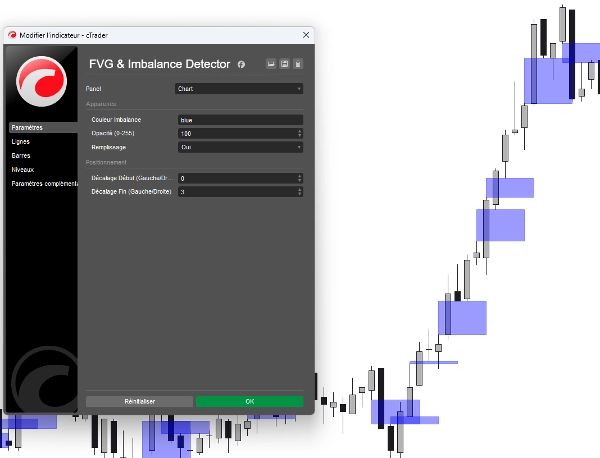
Nel mondo di Smart Money Concepts (SMC) e ICT, gli squilibri di prezzo sono le "impronte digitali" dei grandi operatori istituzionali. Quando il mercato si muove troppo velocemente, lascia dietro di sé un Fair Value Gap (FVG)—una zona di inefficienza a cui il prezzo quasi sempre torna per "riempire" o ritestare.
Il FVG & Imbalance Detector per cTrader è uno strumento ad alte prestazioni progettato per individuare automaticamente queste inefficienze. Niente più disegni manuali—ottieni zone chiare e azionabili direttamente sul tuo grafico.
Perché questo indicatore è indispensabile:
- 🚀 Individua i movimenti istituzionali: Vedi dove grandi banche e hedge fund sono entrati nel mercato con volumi massicci.
- 🎯 Zone ad alta probabilità: Usa gli squilibri identificati come obiettivi magnetici per take-profit o come "Zone d'Oro" per ingressi di precisione.
- 📈 Visualizzazione pulita: Sovrapposizioni rettangolari di alta qualità che rendono l'analisi del trend senza sforzo.
- 🔧 Completamente flessibile: A differenza degli indicatori base, questa versione ti permette di estendere le zone nel futuro o di regolare i loro punti di partenza per adattarsi alla tua strategia specifica.
Caratteristiche esclusive:
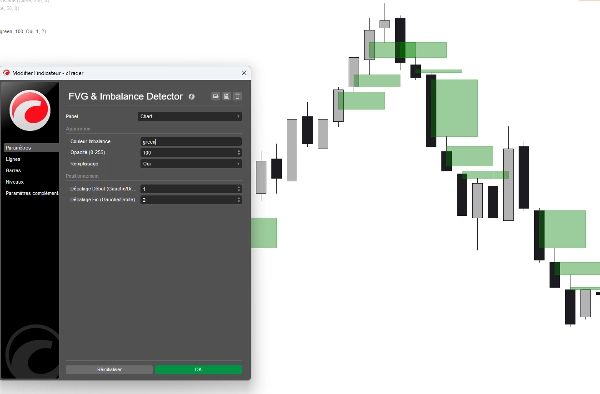
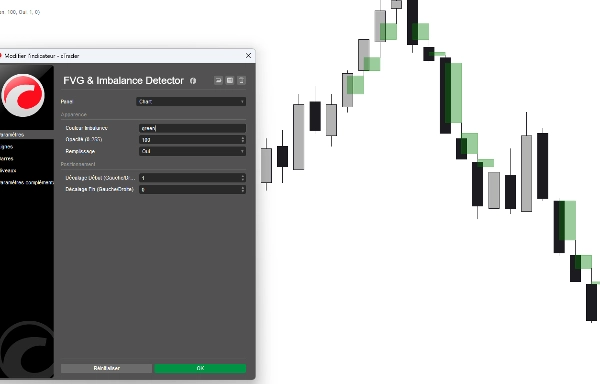
- Logica di rilevamento intelligente: Algoritmo avanzato che identifica con precisione al pixel sia le inefficienze Top (ribassiste) che Bottom (rialziste).
- Offset bidirezionali: Parametri esclusivi di offset "Start" e "End" che ti permettono di proiettare le zone in avanti o indietro per vedere come i gap storici si allineano con l'azione di prezzo attuale.
- Interfaccia colore professionale: Scegli il tuo stile preferito tramite un menu a tendina pulito (Giallo, Acqua, Rosso, ecc.)—niente più digitazioni di codici esadecimali!
- Controllo dell'opacità: Regola la trasparenza in modo che le zone non ingombrino la tua visuale dell'azione di prezzo.
- Prestazioni ottimizzate: Codice leggero che non rallenta la tua piattaforma cTrader, anche su più grafici.
Come usarlo:
- Identifica il Gap: L'indicatore disegna una casella dove si verifica uno squilibrio tra il massimo della prima candela e il minimo della terza.
- Aspetta il Retest: Osserva il prezzo tornare a queste caselle.
- Esegui: Cerca pattern di rifiuto all'interno della zona FVG per ingressi a basso rischio e alto rendimento.
Riepilogo
Riepilogo AI
The FVG & Imbalance Detector is an indicator for the cTrader platform designed to identify Fair Value Gaps (FVG) and price imbalances, key concepts in Smart Money Concepts (SMC) and Institutional Cycle Trading (ICT). These gaps represent zones of market inefficiency created by rapid price moves, often reflecting institutional activity. The indicator automatically detects and highlights these zones on the chart with clear rectangular overlays, eliminating the need for manual drawing.
Key features include detection of both bullish (bottom) and bearish (top) imbalances with high precision, customizable zone extensions via start and end offset parameters, and adjustable opacity and color settings for clear visualization. The tool is optimized for performance to avoid slowing down the platform, even when applied to multiple charts.
Traders can use the indicator to spot where large institutional players have entered the market, identify high-probability zones for entries or take-profits, and monitor price retests of these inefficiency zones for potential trade execution. The indicator supports analysis across various markets including Forex, Indices, Commodities, and Crypto.
Profilo indicatore
Recensioni dei clienti
4.0
Recensioni: 2
5 | 0 % | |
4 | 100 % | |
3 | 0 % | |
2 | 0 % | |
1 | 0 % |
Recensioni dei clienti
January 18, 2026
tested small first and that felt like the right move, and account protection still comes first.
January 14, 2026
Discussioni
Domande frequenti
Forex
Indices
Commodities
Crypto
AI
I prodotti disponibili tramite cTrader Store, inclusi bot di trading, indicatori e plugin, sono forniti da sviluppatori terzi e resi disponibili esclusivamente a scopo informativo e di accesso tecnico. cTrader Store non è un broker e non fornisce consulenze in materia di investimento, raccomandazioni individualizzate o garanzie di risultati futuri.
Altro da questo autore


Prezzo
Da 27/10/2025
10
Vendite