

present
Registrati e ricevi uno sconto da $50 sul tuo primo acquisto
Trading product for Dynamic Bands VWAP Indicatore Fibonacci Key Levels, image 1
Dynamic Bands VWAP
Indicatore
Versione 1.0, Jul 2026
Windows, Mac
Trading product for Dynamic Bands VWAP Indicatore Fibonacci Key Levels, image 2
Trading product for Dynamic Bands VWAP Indicatore Fibonacci Key Levels, image 3
Trading product for Dynamic Bands VWAP Indicatore Fibonacci Key Levels, image 4
Da 24/03/2026
11
Vendite
87
Installazioni gratuite

Descrizione

Non fidarti dei livelli statici di supporto e resistenza, questo indicatore combina il molto usato Fibonacci e VWAP in un'unica configurazione che risolve le carenze di ciascuno. Ora tutti i livelli sono dinamici, basati su Money Flow, Time Blocks e Mathematical Rules.

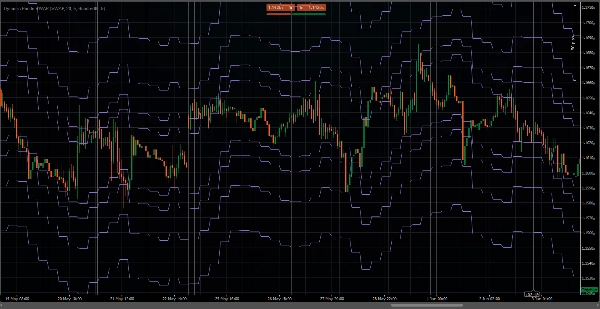
Questo indicatore traccia una scala a gradini di linee orizzontali basate su una media mobile VWAP/TWAP. Invece di una linea continua e liscia, ricalcola la media solo ogni X barre (un “gradino della scala”), disegnando segmenti orizzontali piatti che saltano verticalmente a nuovi livelli ad ogni gradino. Le distanze delle linee sopra e sotto la VWAP/TWAP seguono una sequenza di Fibonacci moltiplicata per una scala percentuale selezionata dall'utente (Scala di Fibonacci).


Parametri

  • Tipo di media – VWAP (ponderata per volume) o TWAP (ponderata per tempo).
  • Periodo (barre) – Finestra di lookback per il calcolo della media.
  • Numero di linee sopra/sotto – Quanti livelli distanziati secondo Fibonacci disegnare su ciascun lato (≥2).
  • Scala di Fibonacci – Unità percentuale base per la spaziatura.
  • Aggiorna ogni X barre – Frequenza del ricalcolo della scala; la media e tutte le linee rimangono costanti tra gli aggiornamenti.


Come usarlo? Può essere usato come:

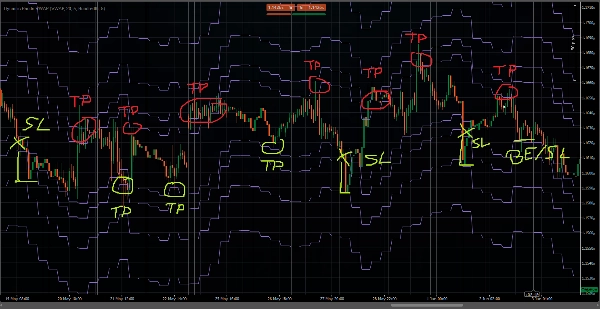
  • Tutte le strategie di Mean-Reversion
  • Validazione di supporto e resistenza
  • Miglior prezzo per entrare e uscire
  • Oscillatore di ipercomprato/ipervenduto
  • Confluenza MTF
  • Sostituzione completa delle Bande di Bollinger
  • E altro.

Riepilogo

Riepilogo AI
Dynamic Bands VWAP is a technical indicator that integrates Fibonacci levels with VWAP (Volume Weighted Average Price) or TWAP (Time Weighted Average Price) to provide dynamic support and resistance levels. Unlike static levels, this indicator recalculates averages and plots horizontal lines in a stepped ladder format every set number of bars, creating flat segments that adjust vertically at each update. The spacing of these lines above and below the average follows a Fibonacci sequence scaled by a user-defined percentage.

Key parameters include the choice between VWAP or TWAP averages, the lookback period for calculations, the number of Fibonacci-spaced lines displayed above and below the average, the Fibonacci scale for spacing, and the frequency of updates (every X bars). The indicator bases its dynamic levels on money flow, time blocks, and mathematical rules.

It can be applied in various trading contexts such as mean-reversion strategies, support and resistance validation, identifying optimal entry and exit prices, overbought/oversold oscillation, multi-timeframe confluence, and as a full alternative to Bollinger Bands. The indicator supports volume and bar data inputs and provides visualizations, signals for breakouts, reversals, volatility regimes, and level touches or breaks.

Profilo indicatore
Categoria indicatore
Supporto e resistenza
Tipo di output
Visualizzazione
Segnali
Filtro
Requisiti per i dati
Solo barre
Volume
Segnali supportati
Rottura
Inversione
Volatilità
Livello raggiunto
Livello rotto

Recensioni dei clienti

0.0
Recensioni: 0
Recensioni dei clienti
Questo prodotto non ha ancora ricevuto recensioni. L'hai già provato? Fallo sapere agli altri per primo!

Discussioni

Domande frequenti

Fibonacci
Key Levels
Volume
VWAP
Support & Resistance
I prodotti disponibili tramite cTrader Store, inclusi bot di trading, indicatori e plugin, sono forniti da sviluppatori terzi e resi disponibili esclusivamente a scopo informativo e di accesso tecnico. cTrader Store non è un broker e non fornisce consulenze in materia di investimento, raccomandazioni individualizzate o garanzie di risultati futuri.

Altro da questo autore

Indicatore
OBV
Volume
+2
Weis Wave indicator based on the original work of David Weis.
Indicatore
VWAP
Volume
+3
Track hidden trading activities to be on the right side of the market.
Indicatore
SMC
Prop
+5
VA Footprint replaces your chart with a order flow one, the most precise way to read the market.
Indicatore
Volume
Order Block
+4
Volume Profile with fixed period, custom range and buy/sell pressure.

Potrebbe interessarti anche

Indicatore
ATR
SMC
+17
Adaptive Swing-Anchored VWAP that tracks market structure shifts with precision and clarity.
Indicatore
ADX
ATR
+5
Identifies TRENDING, RANGING and VOLATILE markets with pullback detection. Anti-noise filter. Works on ANY chart.
Indicatore
Pin Bar
Inducement
+5
Institutional Nasdaq Session Liquidity Map with Live Point HUD, Sweep Alerts & Interactive Playbook.
Indicatore
BOS
Volume
+5
20/40/60-day IPDA lookback ranges, Premium/Discount/Equilibrium zones, and quarterly shift alerts — anchored to true dai
Indicatore
ATR
Prop
Outside Candle Detector: Highlights major candles/zones with ATR filter & pattern labels. By Avydel Talbo, prop trader.
Indicatore
Forex
Fibonacci
+2
Enhance your trading with customizable alerts and dynamic visual tools for trendlines, Fibonacci levels, and more.
Indicatore
Auto-detect supply & demand zones, remove broken levels, and trade smarter with real-time alerts. Precision made simple.
Indicatore
SMC
Forex
+5
ICT liquidity engine for Gold: maps stop clusters, scores zones & projects the next target. Now with 4 ICT killzones.
Indicatore
SMC
Prop
+11
Sessions PRO is a professional session visualization indicator - 4 Fully Customizable Sessions
Indicatore
BOS
CHOCH
+5
MyZTrade High TF candle is a multi-timeframe visualisation tool that overlays completed higher-timeframe candles.
Indicatore
EMA
A visual signal backtester that simulates trades directly on your chart and scores strategy performance.
Indicatore
Forex
EURUSD
+5
Fimathe Indicator - Fimathe PCM - Automated Trend Channels & Levels — Ideal for live trading and backteting
Indicatore
ATR
RSI
+16
Multi-timeframe trend indicator using EMA, MACD & ADX to confirm high-probability buy and sell bias.
Indicatore
EURUSD
GBPUSD
+3
All-in-one suite for ICT concepts: NY Midnight Open, Killzones, automatic Liquidity levels (PDH/L, PWH/L).
Indicatore
Key Levels
Market Structure
+1
Sessions, ICT killzones, multi-ORB and previous levels. One clean, no-repaint cTrader overlay.
Indicatore
ATR
Volume
+2
Heatmap Liquidity Zones Visualize volume-at-price, uncover hidden support/resistance, and track market liquidity in real
Indicatore
VWAP
Volume
+2
Dynamic VWAP with ±1/±2 Standard Deviation Bands for intraday volatility, extremes and mean reversion.
Indicatore
ATR
Volume
+5
Order blocks with measured hold-rate stats and confidence scoring — not just zones on a chart.

Prezzo

Da 24/03/2026
11
Vendite
87
Installazioni gratuite




















