
VA Footprint
อินดิเคเตอร์
2 การซื้อ
เวอร์ชัน 2.0, May 2026
Windows, Mac
4.5
รีวิว: 4
คำอธิบาย
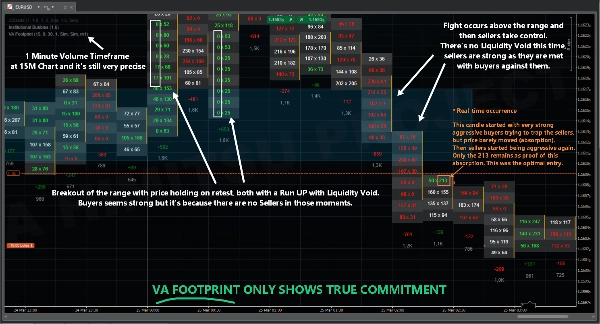
VA Footprint จัดกลุ่มความก้าวร้าวตามกลุ่มทิกซ์ ช่วยขจัดความจำเป็นในการอ้างอิงข้ามระดับ โครงสร้างนี้ยังช่วยให้ทนทานต่อการปลอมแปลง HFT (เช่น การซื้อขายล้างหรือคำสั่งที่ก้าวร้าวผสมในเสียงรบกวน ซึ่งมีจุดประสงค์เพื่อปกปิดเจตนาที่ระดับบิด x อาส์ก) เนื่องจากมันวัดความมุ่งมั่นในกลุ่มทิกซ์ 10 ตัวขึ้นไป จึงยากและมีค่าใช้จ่ายสูงสำหรับกิจกรรมสถาบันที่จะซ่อนรอยเท้าของพวกเขา
พารามิเตอร์ที่ปรับได้ (การตั้งค่าที่เกี่ยวข้อง)
- ระยะเวลากล่อง (นาที) --> ปรับให้ตรงกับกรอบเวลาชาร์ตของคุณ
- ขนาดระดับ (%)
- โหมดมืด (จริง/เท็จ)
- แสดงพื้นที่ค่า (จริง/เท็จ)
- กรอบเวลาปริมาณ (10-ทิกซ์,50-ทิกซ์)
ข้อควรพิจารณาที่สำคัญ
- MARKET REPLAY ที่มีความแม่นยำระดับทิกซ์ใช้งานได้ คุณสามารถใช้เพื่อทดสอบกลยุทธ์ของคุณย้อนหลังและทดสอบตัวบ่งชี้ในช่วงเวลาที่ยาวนานขึ้น
- การเพิ่มระดับทิกซ์จะเพิ่มความแม่นยำ การลดมากเกินไปจะลดความถูกต้อง อย่างน้อย 0.10 เป็นที่แนะนำ
สรุป
สรุปโดย AI
VA Footprint is an order flow indicator that replaces traditional charts with a detailed footprint view, enabling precise market reading. It groups aggressive trading activity by clusters of ticks (typically 10 or more), reducing the need to cross-reference price levels and providing resilience against high-frequency trading spoofing tactics such as wash trading or disguised aggressive orders. This clustering approach makes it difficult for institutional activity to conceal their market footprints.
Key adjustable parameters include box duration (to align with chart timeframe), level size percentage, dark mode toggle, value area display, and volume timeframe selection (e.g., 10-tick or 50-tick clusters). The indicator supports market replay with tick precision, allowing users to backtest strategies over extended periods.
VA Footprint is applicable across multiple markets including Forex, indices, and stocks, and supports trading strategies such as scalping and smart money concepts. It provides visualizations, signals for divergences, breakouts, reversals, trend strength, volatility regimes, and level breaks, relying on tick data, bars, and volume inputs. This tool is designed to enhance market structure analysis and order flow understanding for traders.
โปรไฟล์อินดิเคเตอร์
หมวดหมู่อินดิเคเตอร์
Order flow / DoM
ประเภทเอาต์พุต
การแสดงเป็นภาพ
สัญญาณ
ตัวกรอง
ข้อกำหนดด้านข้อมูล
ข้อมูล Tick
แท่งเท่านั้น
ปริมาณ
สัญญาณที่รองรับ
Divergence
Breakout
Reversal
ความแข็งแกร่งของแนวโน้ม
ความผันผวน
เบรก Level ที่ระบุ
รีวิวจากลูกค้า
4.5
รีวิว: 4
5 | 50 % | |
4 | 50 % | |
3 | 0 % | |
2 | 0 % | |
1 | 0 % |
รีวิวจากลูกค้า
April 10, 2026
A decent setup here should survive 1 percent risk without looking messy. The first month should show both ROI and DD. The next review on it on 30 trades.
April 4, 2026
For risk management, this feels more useful as a filter than a full system. The journal should cover 76 setups and the trade context.
April 4, 2026
The stats tell the story. Tracking 1 percent risk first, compare the result with BE after 1R, and only scale if 1.5R partials still looks controlled.
March 31, 2026
Feels right for a user who wants less noise in the process. The best use is sizing and stop planning, then leaving the final filter manual. The problem appears when the tool makes weak ideas look acceptable.5R partials.
การสนทนา
คำถามที่พบบ่อย
Prop
Forex
Scalping
Indices
SMC
Stocks
Market Structure
ผลิตภัณฑ์ที่มีให้บริการผ่าน cTrader Store รวมถึงบอทการเทรด อินดิเคเตอร์ และปลั๊กอิน มีให้บริการโดยนักพัฒนาบุคคลที่สามและมีไว้เพื่อวัตถุประสงค์ในการเข้าถึงข้อมูลและทางเทคนิคเท่านั้น cTrader Store ไม่ใช่โบรกเกอร์และไม่ได้ให้คำแนะนำการลงทุน คำแนะนำส่วนบุคคล หรือการรับประกันผลการดำเนินงานในอนาคต


ราคา
ตั้งแต่ 24/03/2026
10
การขาย
62
ติดตั้งฟรี