
คำอธิบายตัวชี้วัด:
🎯 ตัวชี้วัด RSI พร้อมระดับ Fibonacci และ Hull Moving Averages 🚀
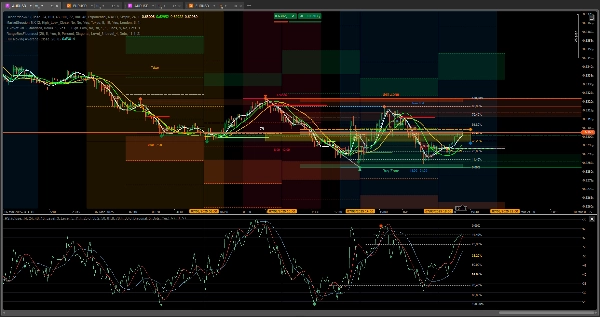
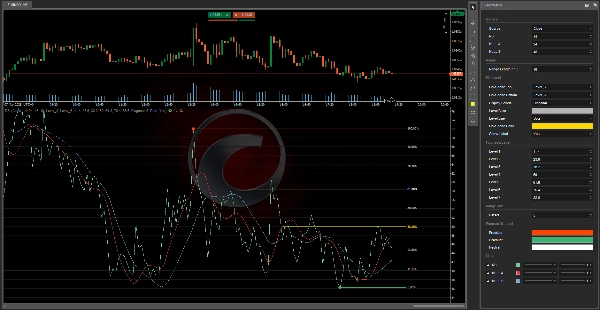
ต้องการยกระดับการวิเคราะห์ทางเทคนิคของคุณหรือไม่? ตัวชี้วัดนี้สำหรับคุณ! มันรวมเครื่องมือที่ทรงพลังสามอย่างที่ดีที่สุด: RSI (Relative Strength Index), ระดับ Fibonacci และ Hull Moving Averages เพื่อให้คุณมีมุมมองที่ครอบคลุมและแม่นยำของตลาด
คุณสมบัติหลัก:
- RSI พร้อมระดับ Fibonacci:
-
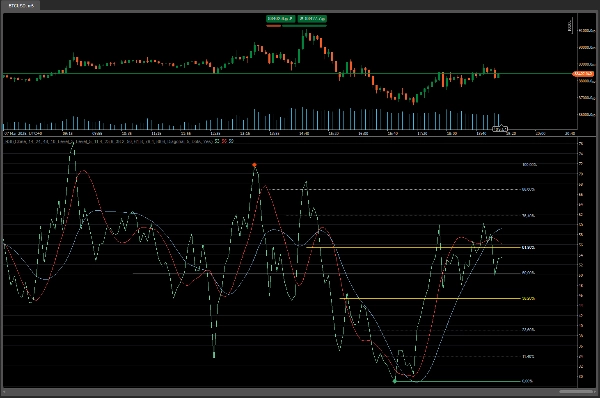
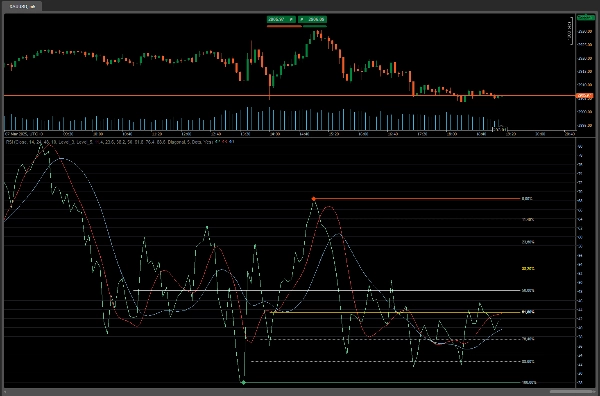
- ระบุโซน แนวรับ และ แนวต้าน ที่สำคัญโดยอิงจากระดับ Fibonacci
- ช่วยตรวจจับการ กลับตัว และ ต่อเนื่อง ได้อย่างแม่นยำมากขึ้น
- Hull Moving Averages:
-
- รวม Hull Moving Averages สองเส้น (Hull A และ Hull B) เพื่อกรองเสียงรบกวนของตลาดและจับแนวโน้มได้อย่างมีประสิทธิภาพมากขึ้น
- ให้สัญญาณ เข้า และ ออก ที่ชัดเจนโดยอิงจากการตัดกันและการเปลี่ยนทิศทาง
- โซนเปลี่ยนแนวโน้ม:
-
- เน้นพื้นที่สำคัญที่มีแนวโน้มจะเกิดการเปลี่ยนแปลงแนวโน้ม ช่วยให้คุณคาดการณ์การเคลื่อนไหวที่สำคัญได้
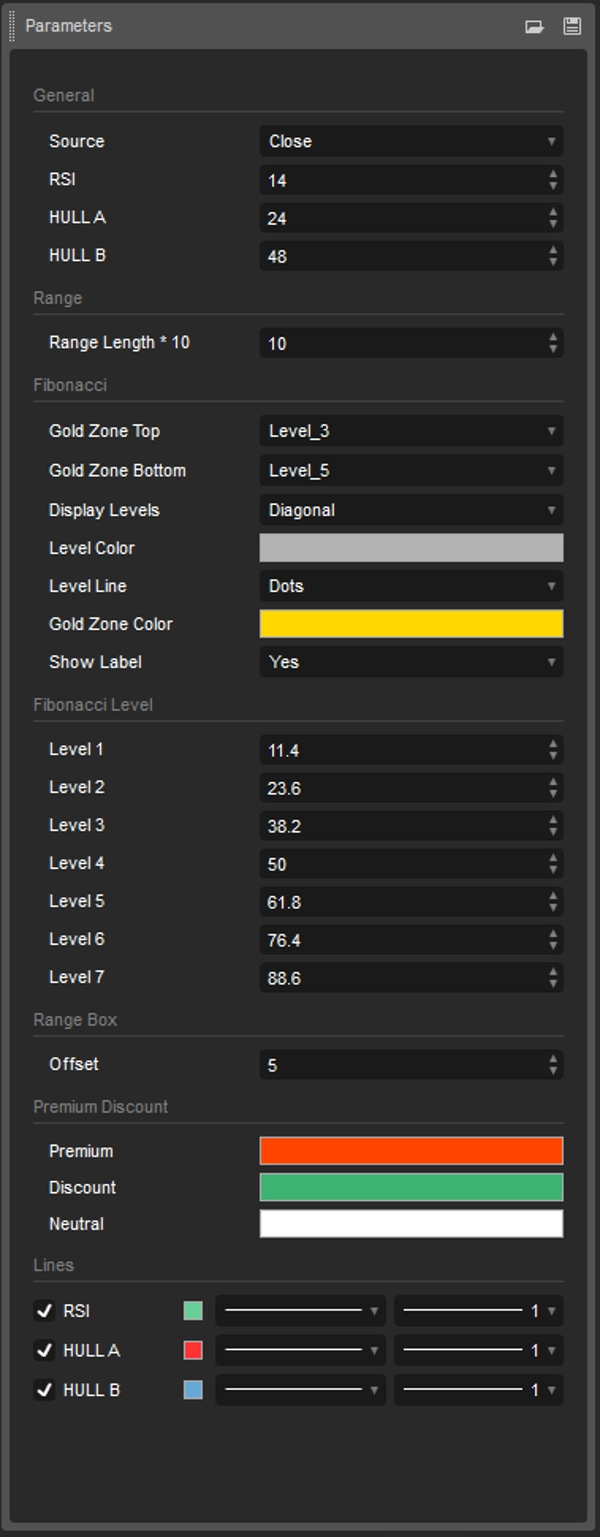
- ปรับแต่งได้เต็มที่:
-
- ปรับระดับ Fibonacci สี และรูปแบบเส้นให้เหมาะกับความชอบของคุณ
- ตั้งค่า Hull Moving Averages ให้เหมาะกับกลยุทธ์การเทรดของคุณ
- การแสดงผลที่ชัดเจน:
-
- ไอคอนและเส้นแนวโน้มที่ชัดเจนเพื่อการตีความที่รวดเร็วและง่ายดาย
- ป้ายกำกับเสริมเพื่อแสดงระดับ Fibonacci เป็นเปอร์เซ็นต์
ประโยชน์สำหรับนักเทรด:
- ความแม่นยำสูงขึ้น: รวม RSI กับระดับ Fibonacci และ Hull Moving Averages เพื่อสัญญาณที่น่าเชื่อถือมากขึ้น
- ประหยัดเวลา: ไม่ต้องซ้อนตัวชี้วัดหลายตัว ทุกอย่างถูกรวมไว้ในเครื่องมือเดียว
- ความหลากหลาย: ใช้ได้กับทุกกรอบเวลาและตลาด (ฟอเร็กซ์ หุ้น สกุลเงินดิจิทัล ฯลฯ)
- ใช้งานง่าย: ออกแบบมาสำหรับนักเทรดทุกระดับ ตั้งแต่ผู้เริ่มต้นจนถึงผู้เชี่ยวชาญ
ทำไมต้องดาวน์โหลดตัวชี้วัดนี้?
- นวัตกรรม: การผสมผสานเครื่องมือคลาสสิกและสมัยใหม่ที่ไม่เหมือนใครซึ่งคุณจะไม่พบในตัวชี้วัดอื่นๆ
- มีประสิทธิภาพ: ช่วยให้คุณระบุโอกาสในการเทรดได้อย่างชัดเจนและมั่นใจมากขึ้น
วิธีใช้งาน:
- ระบุแนวโน้ม: ใช้ Hull Moving Averages เพื่อกำหนดทิศทางตลาด
- มองหาสัญญาณ RSI: ตรวจสอบว่า RSI อยู่ในสภาวะซื้อมากเกินไปหรือขายมากเกินไปใกล้ระดับ Fibonacci หรือไม่
- ยืนยันด้วย Fibonacci: ใช้ระดับ Fibonacci เพื่อระบุโซนแนวรับและแนวต้านที่สำคัญ
- ตัดสินใจอย่างมีข้อมูล: เข้า หรือ ออกการเทรดด้วยความมั่นใจมากขึ้นโดยอิงจากสัญญาณที่ชัดเจนและแม่นยำ
ดาวน์โหลดตอนนี้และปรับปรุงการเทรดของคุณ!
อย่าเสียเวลาวิเคราะห์ชาร์ตด้วยตนเองอีกต่อไป ด้วยตัวชี้วัดนี้ คุณจะมีทุกอย่างที่ต้องการในที่เดียว ทำให้การเทรดของคุณมีประสิทธิภาพและมีกำไรมากขึ้น!
และด้วยเครื่องมือสองตัวนี้ คุณจะหยุดกังวลเกี่ยวกับสิ่งที่ตลาดจะทำได้ เพียงแค่ดูอย่างง่าย ๆ คุณจะรู้ – ซื้อหรือขาย และไปทำงานอื่นต่อ
RangeBoxFibonacci: https://ctrader.com/products/526?u=VIZAINT
OrderPrice-V3: https://ctrader.com/products/397?u=VIZAINT
และสำหรับการเลือก
NTMPICLL https://ctrader.com/products/327?u=VIZAINT
MacdVolume https://ctrader.com/products/267?u=VIZAINT
MarketSession-MX: https://ctrader.com/products/525?u=VIZAINT
5 | 100 % | |
4 | 0 % | |
3 | 0 % | |
2 | 0 % | |
1 | 0 % |


