
คำอธิบาย
✅ ตรวจจับ จุดกลับตัวที่มีความน่าจะเป็นสูงและต่ำ โดยใช้ตรรกะพิวอตขั้นสูง
✅ ปรับแต่งได้อย่างเต็มที่ เครื่องยนต์ความลึก, การเบี่ยงเบน และการถอยหลัง
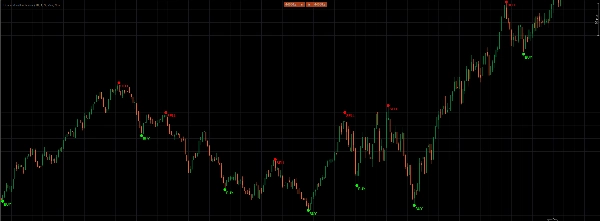
✅ วางแผนโดยอัตโนมัติ ป้ายซื้อและขายที่ชัดเจน บนกราฟ
✅ ตัวเลือก เครื่องหมายพิวอตและไฮไลต์แท่งปัจจุบัน เพื่อความชัดเจนเพิ่มเติม
✅ ออกแบบมาเพื่อจับ การกลับตัวในช่วงต้นด้วยความแม่นยำและมั่นใจ
ปลดปล่อยการเทรดที่แม่นยำด้วย ตัวบ่งชี้ซื้อและขาย: เครื่องยนต์สัญญาณที่ทรงพลังซึ่งใช้พิวอตเป็นฐานในการตรวจจับจุดกลับตัวสูงและต่ำโดยใช้การตั้งค่าความลึก การเบี่ยงเบน และการถอยหลังที่ปรับแต่งได้ กำหนดค่า DepthEngine, DeviationEngine และ BackstepEngine ของคุณเพื่อปรับความไวอย่างละเอียด จากนั้นปล่อยให้ตัวบ่งชี้วางป้าย “BUY” และ “SELL” ที่ชัดเจนโดยอัตโนมัติ—พร้อมด้วยเครื่องหมายพิวอตและแท่งปัจจุบันที่เป็นตัวเลือกในสีโปรดของคุณ—เพื่อให้คุณไม่พลาดการกลับตัวของแนวโน้มอีกต่อไป! เทรดอย่างชาญฉลาด ไม่ใช่ยากขึ้น
สรุป
รีวิวจากลูกค้า
5 | 33 % | |
4 | 67 % | |
3 | 0 % | |
2 | 0 % | |
1 | 0 % |


