
VIX - volatility indicator
Indicator
2 purchases
Version 1.2, Apr 2026
Windows, Mac
4.5
Reviews: 2
Description
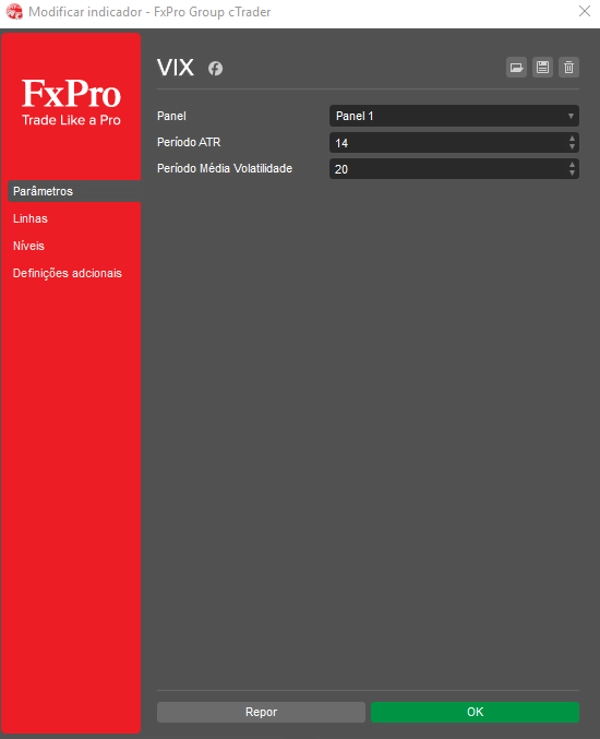
This proprietary VIX indicator, powered by Average True Range (ATR), delivers precise and clean analysis of market volatility, optimized for cTrader 5.5.13+. It combines scaled VIX movement with volume analysis to confirm major shifts and potential breakouts.
Key Features & Code Quality
- Zero Bugs/Warnings: Fully refactored to the latest cTrader API, eliminating all legacy errors and warnings for maximum stability and performance.
- ATR-Based VIX: Provides a responsive measure of volatility, normalized to spot extreme market conditions.
- Dual Confirmation: Uses volatility (VIX line) combined with Tick Volume data to validate high-probability breakout alerts.
Customize Your Setup for Maximum Insight
Easily fine-tune the indicator to match your trading strategy by setting the desired values for Low VIX Level and High VIX Level thresholds. Additionally, adjust the VIX Scale Factor to precisely control the height and visualization of the VIX line in the lower panel.
How to Read Breakout & Consolidation Signals
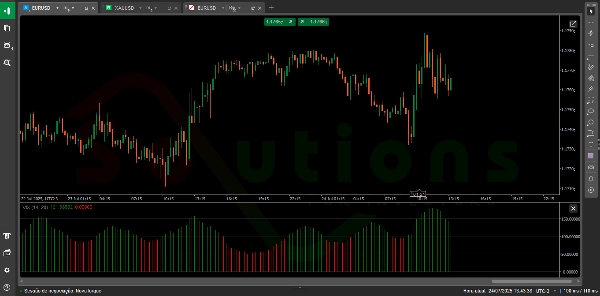
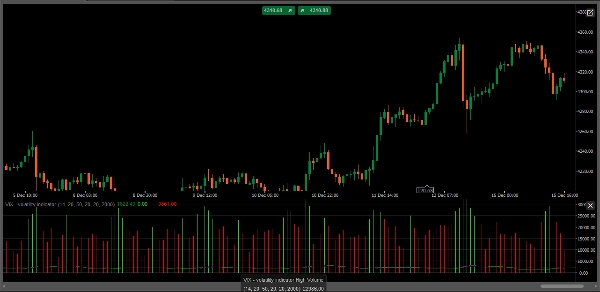
- Breakout Alert (High Volatility): When the VIX line breaks strongly above the High VIX Level AND is accompanied by high volume (indicated by the High Volume histogram), this confirms extreme fear/greed and signals a high-probability market breakout.
- Consolidation Signal (Low Volatility): When the VIX line falls below the Low VIX Level, it often indicates a period of market calm, tight consolidation, or potential mean-reversion — ideal for preparing your next move or scaling back risk.
- Volume Insights: The indicator plots High Volume (Green) and Low Volume (Red) histograms in the background, allowing you to instantly gauge the liquidity and conviction behind the current price action.
Summary
AI summary
The VIX - Volatility Indicator is a proprietary tool designed for the cTrader platform (version 5.5.13 and above) that measures market volatility using an Average True Range (ATR)-based approach. It combines a scaled VIX line with tick volume data to provide dual confirmation of market conditions, helping traders identify potential breakouts and consolidation phases.
Key features include:
- ATR-based VIX calculation for responsive volatility measurement normalized to detect extreme market conditions.
- Volume analysis with high (green) and low (red) volume histograms to assess liquidity and conviction behind price movements.
- Customizable parameters allowing users to set Low VIX Level and High VIX Level thresholds, as well as adjust the VIX Scale Factor for optimal visualization.
Usage signals:
- A breakout alert occurs when the VIX line surpasses the High VIX Level accompanied by high volume, indicating potential market breakouts driven by extreme fear or greed.
- A consolidation signal is identified when the VIX falls below the Low VIX Level, suggesting periods of low volatility, market calm, or potential mean reversion.
This indicator supports analysis across various markets including Forex, indices, commodities, stocks, and cryptocurrencies.
Indicator profile
Customer reviews
4.5
Reviews: 2
5 | 50 % | |
4 | 50 % | |
3 | 0 % | |
2 | 0 % | |
1 | 0 % |
Customer reviews
March 6, 2025
ngl, breaks are easier to judge and that is enough to keep testing it. It is not the whole trading plan.
February 28, 2025
reads better when the chart already supports the idea. Spread and slippage need a line in the notes.
Discussion
FAQ
BTCUSD
Forex
Signal
Breakout
Indices
EURUSD
Commodities
GBPUSD
NZDUSD
Prop
Crypto
Stocks
XAUUSD
NAS100
USDJPY
Products available through cTrader Store, including trading bots, indicators and plugins, are provided by third-party developers and made available for informational and technical access purposes only. cTrader Store is not a broker and does not provide investment advice, personal recommendations or any guarantee of future performance.


Price
Since 05/02/2025
31
Sales