
Descrizione
SR COMMANDER — Edizione Multi Timeframe
Vedi dove i grandi capitali tracciano la linea. Fai trading sul tuo timeframe. Pensa sul loro.
La maggior parte degli strumenti di supporto e resistenza sono vincolati al timeframe del tuo grafico. Se stai facendo scalping su M1, i tuoi livelli di S/R provengono dalle candele M1 — piccole, rumorose e facilmente falsificabili. SR Commander MTF rompe questa catena.
Imposta il tuo grafico su M1. Imposta il tuo timeframe SR su H1. Ora stai facendo scalping con la precisione di un grafico a un minuto, ma i tuoi livelli di supporto e resistenza sono tracciati dalle candele orarie dove istituzioni, algoritmi e trader professionisti prendono realmente le loro decisioni. Questo è il vantaggio.
COME FUNZIONA IL MOTORE MULTI TIMEFRAME
L'indicatore esegue due flussi di dati indipendenti simultaneamente.
Il tuo timeframe del grafico controlla ciò che vedi — le tue candele, i tuoi ingressi, le tue frecce, il tuo timing. Il tuo timeframe SR controlla da dove provengono i livelli. Questi due flussi sono mappati l'uno sull'altro in tempo reale, barra per barra. Quando una nuova candela del grafico si chiude, SR Commander cerca la candela corretta del timeframe SR per quel momento esatto e ricalcola i livelli dalla struttura di quel timeframe superiore.
Ciò significa che la tua linea di supporto verde e la linea di resistenza rossa riflettono sempre la struttura ponderata per volatilità del timeframe SR che hai selezionato — non il rumore del grafico che stai guardando.
LA SCIENZA DIETRO I LIVELLI
SR Commander non traccia semplicemente linee ai massimi e minimi di oscillazione. Usa un modello di volatilità Yang-Zhang — la stessa classe di stimatore di volatilità usata nella ricerca quantitativa professionale — per calcolare il vero peso statistico di ogni candela. Ogni livello deriva da una struttura di prezzo normalizzata, considerando gap overnight, movimento da apertura a chiusura e range intrabar. Il risultato sono livelli che hanno un reale significato matematico, non solo una prominenza visiva.
CIÒ CHE VEDI SUL GRAFICO
- 🟢 Linea di supporto verde — il pavimento statisticamente significativo più vicino sotto il prezzo attuale, preso dal timeframe SR scelto
- 🔴 Linea di resistenza rossa — il soffitto statisticamente significativo più vicino sopra il prezzo attuale, preso dal timeframe SR scelto
- ⬆️ Segnale BUY — si attiva quando il prezzo rimbalza dal supporto con una chiusura rialzista confermata sulla candela del timeframe SR
- ⬇️ Segnale SELL — si attiva quando il prezzo respinge la resistenza con una chiusura ribassista confermata sulla candela del timeframe SR
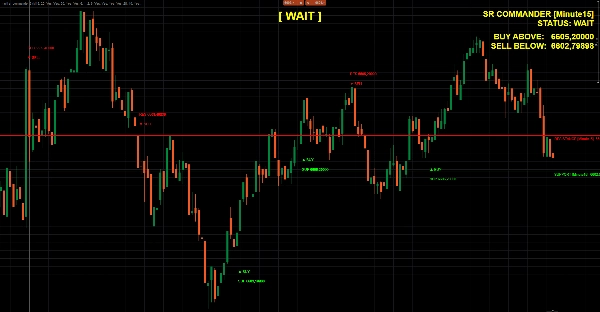
- 📊 Dashboard live — mostra il timeframe SR attivo, lo stato corrente e i prezzi esatti di trigger del breakout
- 🔵 Grande etichetta di stato — BUY / SELL / WAIT, aggiornata ogni barra in alto al centro del tuo grafico
- 🕓 Sovrapposizione storica — rimbalzi, rifiuti, breakout e breakdown segnati sul grafico per una validazione visiva immediata
COMBINAZIONI DI TIMEFRAME CHE FUNZIONANO
Timeframe GraficoTimeframe SRCaso d'uso
M1
M5 o M15
Scalping veloce con struttura a breve termine
M5
H1
Trading intraday con livelli orari
M15
H4
Ingressi swing con struttura a 4 ore
H1
D1
Trading di posizione basato su S/R giornalieri
Qualsiasi
Grafico
Modalità classica — comportamento originale a singolo TF
CARATTERISTICHE
- Motore multi timeframe completo — qualsiasi timeframe SR su qualsiasi timeframe grafico
- Calcolo dei livelli normalizzato sulla volatilità Yang-Zhang
- Inclusione della candela più grande — cattura sempre la candela dominante della struttura del periodo di lookback
- Logica di segnale di rimbalzo e rifiuto con tolleranza e buffer configurabili
- Rilevamento di breakout e breakdown con buffer regolabile
- Sovrapposizione di segnali storici per validazione immediata basata sul grafico
- Dashboard ed etichetta di stato grande con dimensioni e colori del font completamente personalizzabili
- Zero repaint — tutti i segnali basati su candele chiuse quando la modalità di conferma è attiva
PER CHI È?
Trader che comprendono che i migliori ingressi vivono su timeframe inferiori, ma i migliori livelli vivono su quelli superiori. Se hai mai tracciato livelli H4 a mano mentre facevi trading su M5 — SR Commander automatizza l'intero processo, lo mantiene matematicamente fondato e mette il segnale direttamente sul tuo grafico nel momento in cui il prezzo reagisce.
Struttura di timeframe superiore. Precisione di timeframe inferiore. Un indicatore.
Riepilogo
The indicator calculates S/R levels using the Yang-Zhang volatility model, which accounts for overnight gaps, open-to-close movement, and intrabar range to produce statistically significant levels rather than simple swing highs and lows. On the chart, it shows a green support line and a red resistance line representing the nearest significant levels below and above the current price from the chosen S/R timeframe.
Additional features include buy and sell signals triggered by price reactions to these levels confirmed on the S/R timeframe, a live dashboard displaying current status and breakout prices, a large status label indicating BUY, SELL, or WAIT, and historical overlays marking past bounces, rejections, and breakouts. The indicator supports various timeframe combinations suitable for scalping, intraday, swing, and position trading across markets including forex, indices, commodities, stocks, and crypto.
Recensioni dei clienti
5 | 50 % | |
4 | 50 % | |
3 | 0 % | |
2 | 0 % | |
1 | 0 % |


