Indicatore Whale Hunting – Bukhari Academy
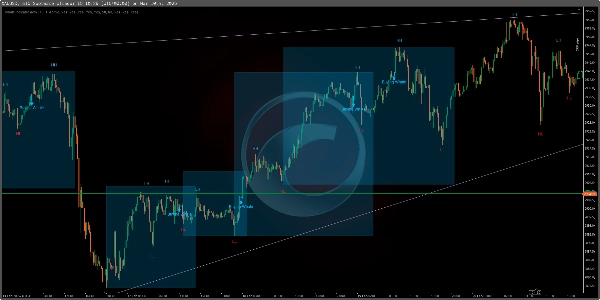
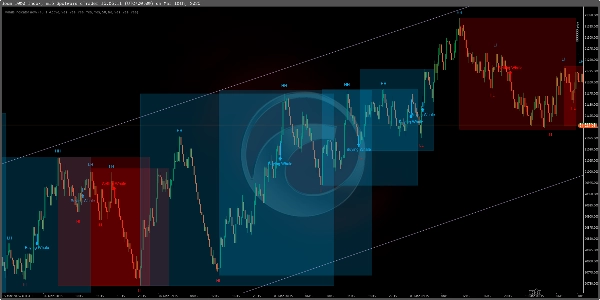
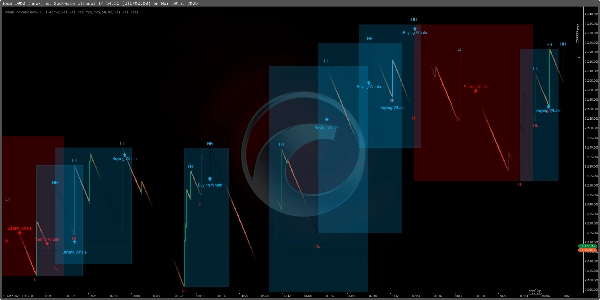
L'Indicatore Whale Hunting è uno strumento di trading potente progettato specificamente per gli indici Boom & Crash e gli indici di Volatilità. Presenta un Rilevatore di Trend Automatico, rileva trend rialzisti e ribassisti, segna punti di struttura di mercato (HH, HL, LH, LL), e fornisce segnali di acquisto e vendita ad alta precisione per aiutare i trader a prendere decisioni informate.
Caratteristiche principali:
✅ Rilevatore di Trend Automatico – Identifica automaticamente i trend di mercato, riducendo la necessità di analisi manuale.
✅ Progettato per gli indici Boom & Crash e Volatilità – Ottimizzato per il trading di questi mercati sintetici.
✅ Rilevamento Spike su Boom & Crash (Timeframe M1) – Identifica potenziali spike su M1, aiutando i trader a cogliere movimenti rapidi di prezzo.
✅ Identificazione del Trend su M15 – Funziona efficacemente su M15 per analisi di trend normali e configurazioni di trading strutturate.
✅ Analisi della Struttura di Mercato – Mostra Higher Highs (HH), Higher Lows (HL), Lower Highs (LH) e Lower Lows (LL) per una migliore comprensione del trend.
✅ Segnali di Entrata Whale – Evidenzia i punti "Whale Acquirente" e "Whale Venditore" per entrate di trading precise.
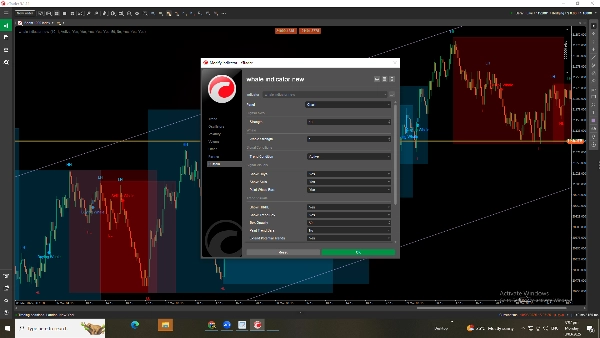
✅ Impostazioni Completamente Personalizzabili – Regola forza della whale, sensibilità del segnale e condizioni di trend per affinare il tuo approccio di trading.
✅ Abilita/Disabilita Funzionalità – Attiva o disattiva box di trend, punti di struttura e segnali di acquisto/vendita secondo necessità.
Come usare l'Indicatore Whale Hunting?
1️⃣ Rilevamento Automatico del Trend – Lascia che l'indicatore identifichi automaticamente la direzione del trend.
2️⃣ Trading degli Spike Boom & Crash su M1 – Cerca segnali su M1 per catturare efficacemente gli spike di prezzo.
3️⃣ Analizza i Trend di Mercato su M15 – Usa M15 per un'analisi strutturata del trend e conferma del trade.
4️⃣ Segui la Struttura di Mercato – Usa HH, HL, LH, LL per comprendere la direzione e la forza del trend.
5️⃣ Cerca i Segnali Whale – Entra nei trade ai punti "Whale Acquirente" o "Whale Venditore".
6️⃣ Personalizza per Maggiore Precisione – Regola forza della whale e sensibilità del segnale per ottimizzare i risultati.
7️⃣ Abilita/Disabilita Funzionalità – Modifica le condizioni di trend e le impostazioni di struttura secondo la tua strategia.
Questo indicatore è perfetto per gli indici Boom & Crash e Volatilità, offrendo opportunità di trading ad alta probabilità con precisione ed efficienza. 🚀
5 | 33 % | |
4 | 67 % | |
3 | 0 % | |
2 | 0 % | |
1 | 0 % |