
SwingHighLow
Indicatore
10 acquisti
Versione 1.0, Jul 2025
Windows, Mac
4.3
Recensioni: 3
Descrizione
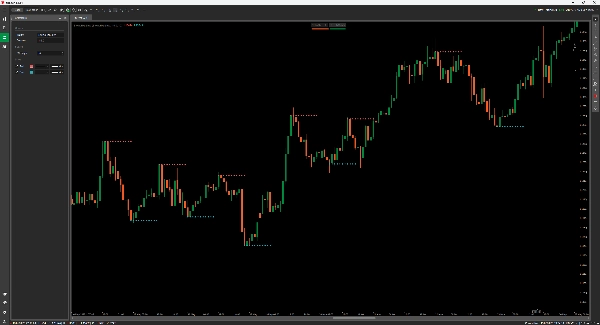
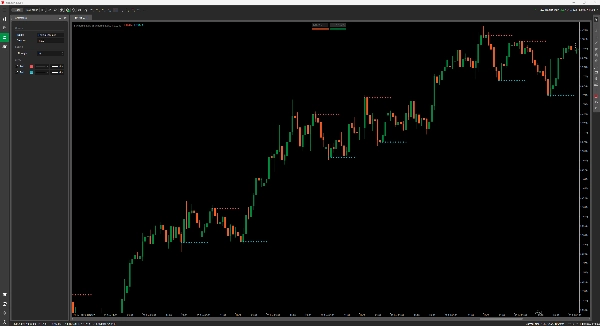
Indicatore Swing High/Low per cTrader
Mappa la Struttura del Mercato come un Professionista.
Questo indicatore Swing High/Low rileva automaticamente e traccia i punti di svolta significativi sul tuo grafico—perfetto per i trader che si basano sull’azione del prezzo, sulla struttura e sulle zone di supporto/resistenza.
Caratteristiche:
- Evidenzia swing high confermati (rosso) e swing low (blu) con tracciamenti puliti dei punti.
- Parametro Strength regolabile che ti permette di filtrare il rumore o rendere i segnali più precisi.
- Ideale per l’analisi del trend, l’individuazione di inversioni e le trappole di breakout.
Funziona su tutti i timeframe. Nessun repainting. Solo una solida struttura di mercato, chiaramente marcata.
Riepilogo
Riepilogo AI
The SwingHighLow indicator for cTrader automatically detects and plots significant swing highs and lows on price charts, aiding traders in identifying market structure, price reversals, and support/resistance zones. It highlights confirmed swing highs in red and swing lows in blue with clear point markers. The indicator includes an adjustable strength parameter that allows users to filter market noise or tighten signal sensitivity according to their trading preferences. It is suitable for use across all timeframes and supports analysis for various markets including Forex, indices, commodities, stocks, and cryptocurrencies such as BTCUSD, EURUSD, and XAUUSD. The tool is designed to assist with trend analysis, spotting reversals, and identifying breakout traps without repainting, providing consistent and reliable market structure visualization.
Profilo indicatore
Recensioni dei clienti
4.3
Recensioni: 3
5 | 67 % | |
4 | 0 % | |
3 | 33 % | |
2 | 0 % | |
1 | 0 % |
Recensioni dei clienti
July 22, 2025
Good support for rules for swing point analysis. it helps identify turning points and cleaner structure, especially when used for reviewing reversals, pullbacks and swing zones. Swing points look better after 3 pivots, especially when the 0.5 Fib area agrees with structure. The level is useful when it supports the market story.
July 21, 2025
July 21, 2025
Practical choice for demo for a more controlled workflow. It helps with reviewing reversals, pullbacks and swing zones, but the signal still needs broader context. Swing points look better after 3 pivots, especially when the 0.5 Fib area agrees with structure. I would still keep manual review in the process.
Discussioni
Domande frequenti
BTCUSD
Forex
Signal
Breakout
Indices
EURUSD
Supertrend
Commodities
Stocks
XAUUSD
ATR
I prodotti disponibili tramite cTrader Store, inclusi bot di trading, indicatori e plugin, sono forniti da sviluppatori terzi e resi disponibili esclusivamente a scopo informativo e di accesso tecnico. cTrader Store non è un broker e non fornisce consulenze in materia di investimento, raccomandazioni individualizzate o garanzie di risultati futuri.


![Logo di "[Hamster-Coder] Bollinger Bands"](https://cdn.ctrader.com/image/webp/21d8e5d6-fb11-4bac-b9ee-cd05c2b76804_30327)


Prezzo
Da 03/01/2025
638.03K
Volume negoziato
21.34K
Profitto in pip
15
Vendite