
Descrizione
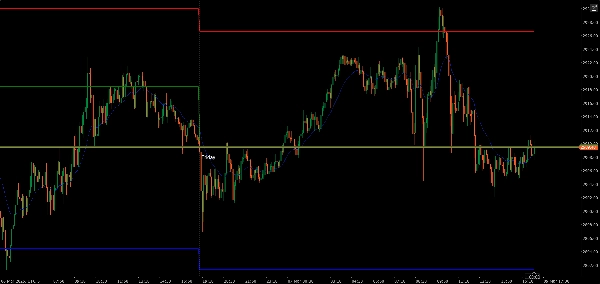
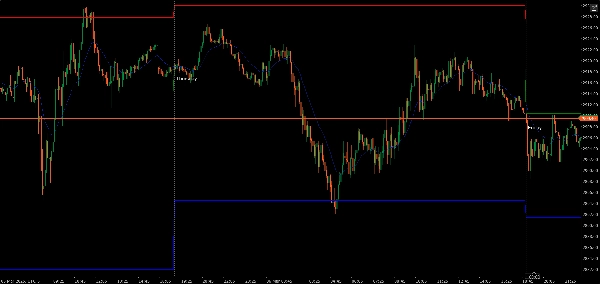
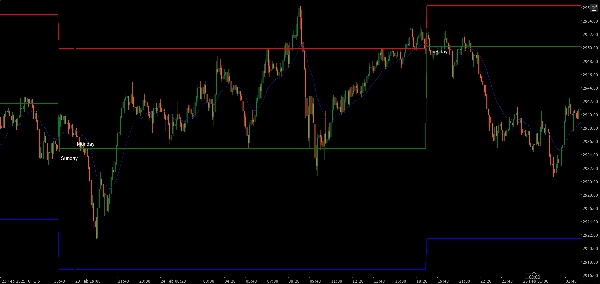
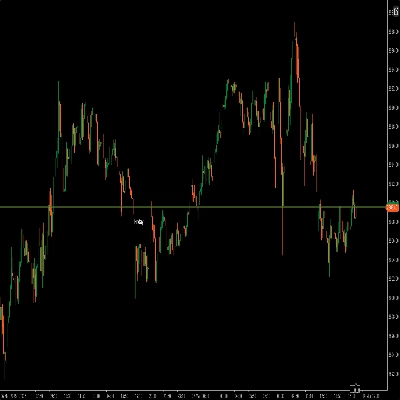
indicatore del massimo, minimo e chiusura del giorno precedente.
la linea blu mostra il minimo del giorno precedente.
la linea rossa mostra il massimo del giorno precedente.
la linea verde mostra la chiusura del giorno precedente.
Riepilogo
Riepilogo AI
The trPDHLC indicator displays the previous day's high, low, and closing prices on a trading chart. It uses color-coded lines for clear visualization: a red line marks the previous day's high, a blue line indicates the previous day's low, and a green line shows the previous day's closing price. This tool helps traders quickly reference key price levels from the prior trading day, aiding in technical analysis and decision-making. The indicator is tagged for use with indices markets.
Profilo indicatore
Recensioni dei clienti
0.0
Recensioni: 0
Recensioni dei clienti
Questo prodotto non ha ancora ricevuto recensioni. L'hai già provato? Fallo sapere agli altri per primo!
Discussioni
Domande frequenti
Indices
I prodotti disponibili tramite cTrader Store, inclusi bot di trading, indicatori e plugin, sono forniti da sviluppatori terzi e resi disponibili esclusivamente a scopo informativo e di accesso tecnico. cTrader Store non è un broker e non fornisce consulenze in materia di investimento, raccomandazioni individualizzate o garanzie di risultati futuri.
Altro da questo autore


Prezzo
Da 08/03/2025
1
Vendite