
Vision - Advanced Session Indicator
Indicador
6 compras
Versão 1.0, Jul 2025
Windows, Mac
5.0
Avaliações: 2
Descrição
Indicador Avançado de Sessão
Descrição:
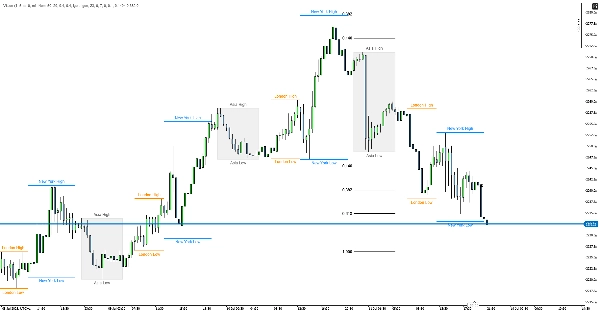
Indicador profissional de sessão para cTrader que exibe faixas de preço das principais sessões de negociação e adiciona análise de perfil de volume para cada sessão.
Principais Recursos:
📊 Caixas e Linhas de Preço da Sessão
- 4 principais sessões de negociação: Ásia, Frankfurt, Londres, Nova York
- Tempo totalmente personalizável: Cada sessão pode ser configurada separadamente
- Caixas e linhas de faixa de preço codificadas por cores: Exibe visualmente os valores máximos/mínimos para cada sessão
- Gerenciamento automático de fuso horário
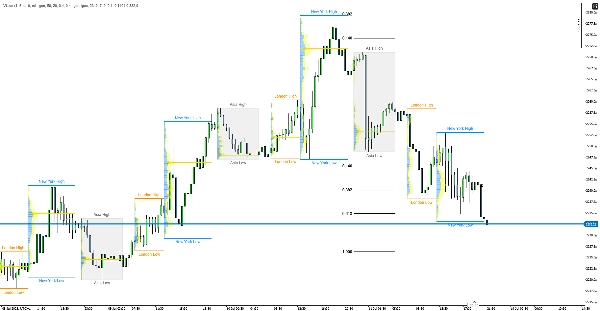
📈 Perfil de Volume da Sessão
- Exibição da distribuição de volume: Perfil de volume separado para cada sessão
- Volume de compra/venda: Cores separadas (azul/amarelo)
- POC (Ponto de Controle): Marcação do nível de preço com maior volume
- Resolução personalizável: Histograma de volume com 10-500 níveis
Configurações
Horários das Sessões
- Ásia: 23:00-07:00 (Cinza)
- Frankfurt: 07:00-08:00 (Verde Escuro)
- Londres: 09:00-14:00 (Laranja)
- Nova York: 14:00-22:00 (Azul)
Opções Personalizáveis
- Transparência e cores das caixas e linhas
- Variação da extensão da sessão Ásia
- Largura e transparência do histograma de volume
- Número de dias para exibição
- Exibição da linha POC
- Intervalos de tempo separados para caixas de sessão e perfil de volume
Uso
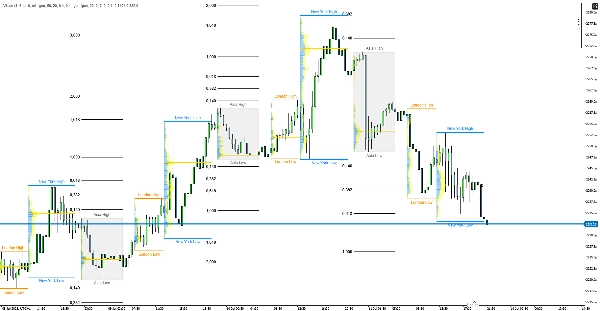
Aplicação em Negociação:
- Níveis máximos/mínimos da sessão como pontos de S/R
- Clusters de volume para marcar níveis significativos
- Linhas POC como níveis magnéticos
- Sobreposições de sessões de importância destacada
Vantagens: Análise combinada de ação de preço e volume, atualizações em tempo real, total personalização, aparência profissional.
Resumo
Resumo de IA
Vision - Advanced Session Indicator is a professional tool designed for the cTrader platform to visualize and analyze major trading sessions: Asia, Frankfurt, London, and New York. It displays session price ranges using color-coded boxes and lines, highlighting high and low values for each session. The indicator supports full customization of session times, colors, transparency, and display settings, including separate timeframes for session boxes and volume profiles.
Key features include a session volume profile that shows volume distribution with distinct buy/sell volume colors and marks the Point of Control (POC), the price level with the highest traded volume. Users can customize the volume histogram resolution from 10 to 500 levels. The indicator automatically handles time zones and adjusts for Daylight Saving Time to ensure accurate session tracking.
Vision aids traders by marking session high/low levels as support and resistance points, identifying volume clusters and liquidity zones, and highlighting session overlaps. It is particularly useful for day traders seeking detailed insights into market behavior and potential entry levels based on volume and price action across different trading sessions.
Perfil do indicador
Avaliações de clientes
5.0
Avaliações: 2
5 | 100 % | |
4 | 0 % | |
3 | 0 % | |
2 | 0 % | |
1 | 0 % |
Avaliações de clientes
July 27, 2025
The entry needs one more reason to make sense, but the market context still matters.
July 15, 2025
The practical angle is weak trade ideas become less attractive, and signal count matters more than one nice example.
Conversa
Perguntas frequentes
Prop
Forex
Indices
Crypto
Os produtos disponíveis através da cTrader Store, incluindo bots de negociação, indicadores e plugins, são fornecidos por programadores terceiros e são disponibilizados apenas para fins informativos e de acesso técnico. A cTrader Store não é um corretor e não fornece aconselhamento em matéria de investimento, recomendações pessoais ou qualquer garantia de desempenho no futuro.


![Logótipo de "Smart Money Concepts (SMC) [Iridio Capital]"](https://cdn.ctrader.com/image/webp/28b69fd1-ef54-4bed-9487-07e78e883be4_40934)


Preço
Desde 05/01/2025
14
Vendas