
WVAP-Bands Indicator_noSourceCode
Indicador
1 compras
Versão 1.0, Sep 2025
Windows, Mac
4.5
Avaliações: 2
Descrição
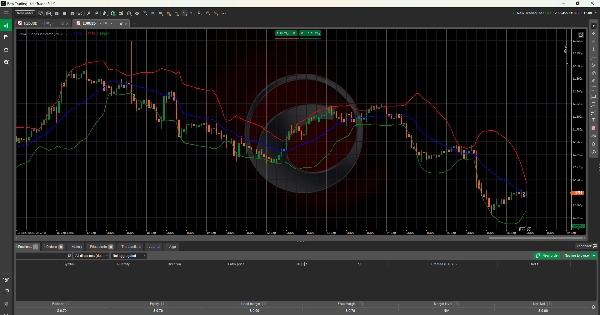
Bandas VWAP - Análise Profissional de Volume
Transforme Seu Trading com Precisão de Nível Institucional
O indicador Bandas VWAP oferece análise profissional de preço ponderado por volume com bandas dinâmicas de desvio padrão. Usado por traders institucionais em todo o mundo para identificar pontos ótimos de entrada e saída.
🚀 Principais Recursos
- Cálculo Verdadeiro do VWAP: Preço médio ponderado por volume usando a metodologia HLC/3
- Bandas Dinâmicas: Bandas superior/inferior baseadas no desvio padrão ponderado por volume
- Personalização Completa: Períodos ajustáveis, cores e multiplicadores de largura das bandas
- Análise em Tempo Real: Atualiza a cada barra para insight imediato do mercado
📊 Aplicações de Trading
- Sobrecomprado/Sobrevendido: Banda superior = sinais de venda, Banda inferior = sinais de compra
- Suporte/Resistência Dinâmicos: VWAP atua como nível de referência institucional
- Reversão à Média: Operações de reversão quando o preço se estende aos extremos da banda
- Confirmação de Tendência: Rompimentos fortes através das bandas sinalizam continuação
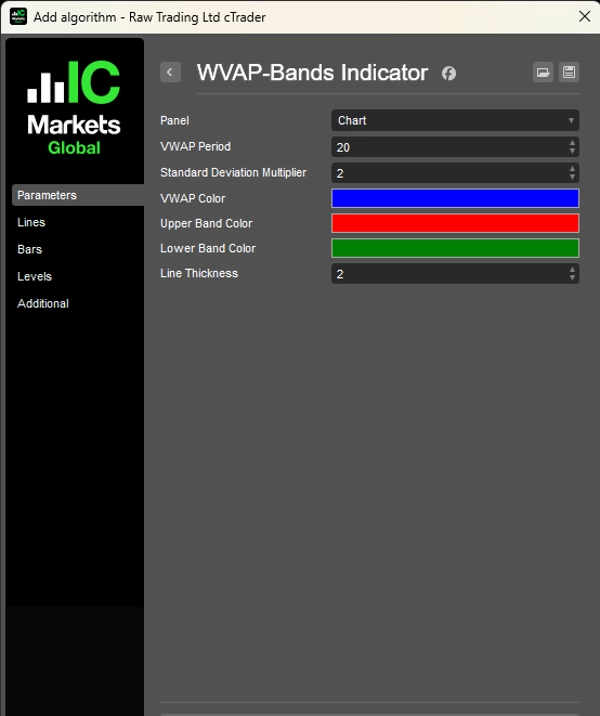
⚙️ Configurações Profissionais
- Período VWAP: 1-200 barras (padrão: 20)
- Desvio Padrão: Multiplicador de 0,1-5,0 (padrão: 2,0)
- Personalização Visual: Cores personalizadas e espessura da linha
- Multi-Intervalo de Tempo: Funciona em todos os intervalos e instrumentos
✅ Por Que Bandas VWAP?
Superior às médias móveis simples, as Bandas VWAP oferecem:
- Precisão ponderada por volume para análise institucional verdadeira
- Volatilidade adaptativa nas bandas que se ajustam às condições do mercado
- Metodologia profissional usada por traders bem-sucedidos globalmente
- Aplicação universal em forex, ações, criptomoedas e commodities
Perfeito para scalpers, day traders e swing traders que buscam análise profissional de volume.
Compatível com cTrader 4.0+. Funciona em todos os instrumentos e intervalos de tempo.
Resumo
Resumo de IA
The WVAP-Bands Indicator provides volume-weighted average price (VWAP) analysis enhanced with dynamic standard deviation bands. It calculates VWAP using the HLC/3 price method and overlays upper and lower bands based on volume-weighted standard deviation, offering adaptive volatility measures. The indicator supports full customization of periods, colors, and band width multipliers, allowing traders to tailor it to their strategies. It updates in real time with each new bar, delivering immediate market insights.
Key trading applications include identifying overbought and oversold conditions (upper band signals sell, lower band signals buy), dynamic support and resistance levels with VWAP as an institutional reference, mean reversion opportunities when prices reach band extremes, and trend confirmation through breakouts beyond the bands. Settings allow adjustment of VWAP period (1–200 bars), standard deviation multiplier (0.1–5.0), and visual elements such as colors and line thickness.
The indicator is compatible with all timeframes and instruments, including forex, stocks, cryptocurrencies, commodities, and indices. It is designed for scalpers, day traders, and swing traders seeking professional-grade volume analysis and is compatible with cTrader 4.0 and above.
Perfil do indicador
Avaliações de clientes
4.5
Avaliações: 2
5 | 50 % | |
4 | 50 % | |
3 | 0 % | |
2 | 0 % | |
1 | 0 % |
Avaliações de clientes
October 4, 2025
The sample size matters. The useful metric is POC and VWAP first, compare the result with 20 reactions, and only scale if 2 sessions still looks controlled.
October 3, 2025
I liked it more as a extra filter for volume based context than as something to follow blindly. Pressure is easier to read, and the final decision still feels like it belongs to the trader. The next review on it on value area.
Conversa
Perguntas frequentes
BTCUSD
Forex
Signal
Breakout
Indices
EURUSD
Commodities
GBPUSD
NZDUSD
Prop
Scalping
Crypto
Stocks
XAUUSD
NAS100
USDJPY
VWAP
Os produtos disponíveis através da cTrader Store, incluindo bots de negociação, indicadores e plugins, são fornecidos por programadores terceiros e são disponibilizados apenas para fins informativos e de acesso técnico. A cTrader Store não é um corretor e não fornece aconselhamento em matéria de investimento, recomendações pessoais ou qualquer garantia de desempenho no futuro.
Mais deste autor


Preço
Desde 15/01/2025
7
Vendas