

الوصف
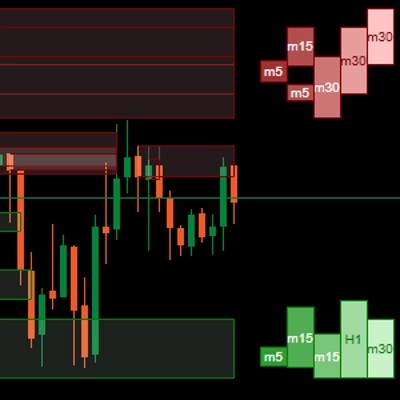
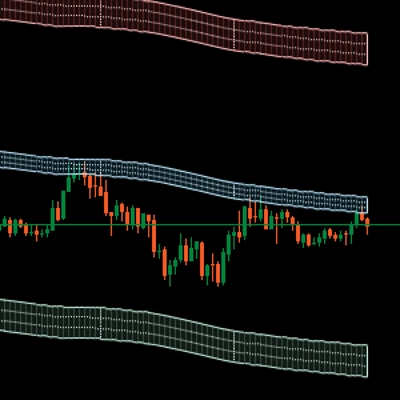
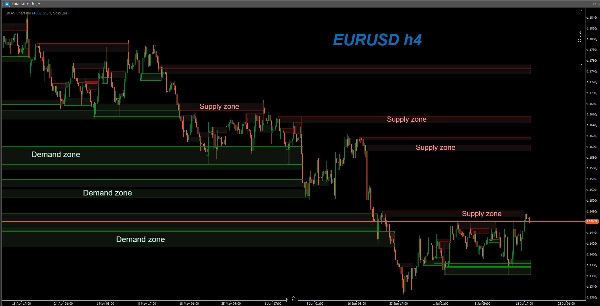
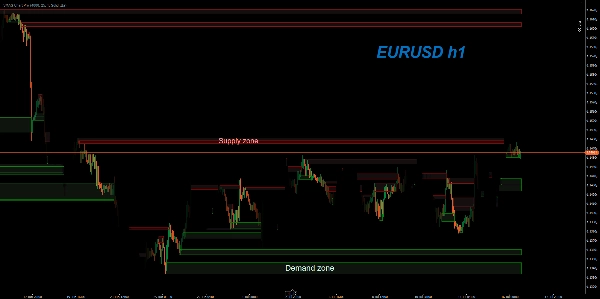
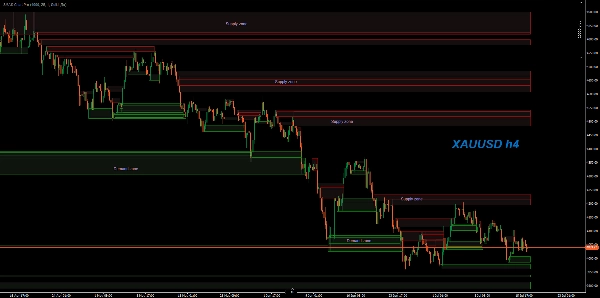
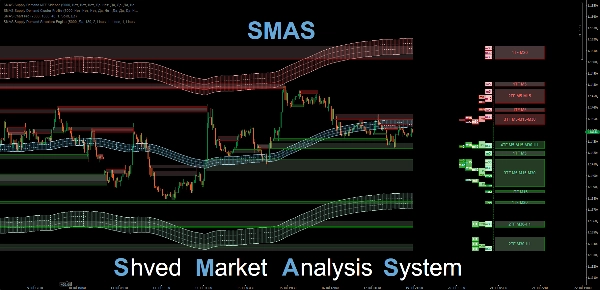
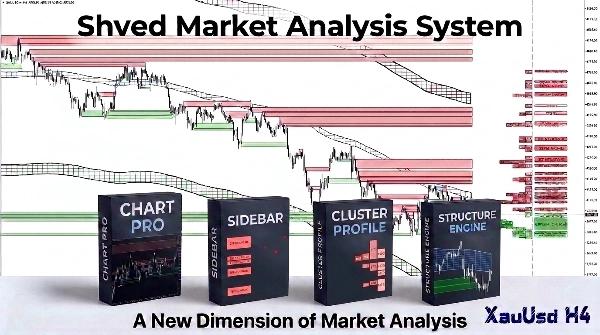
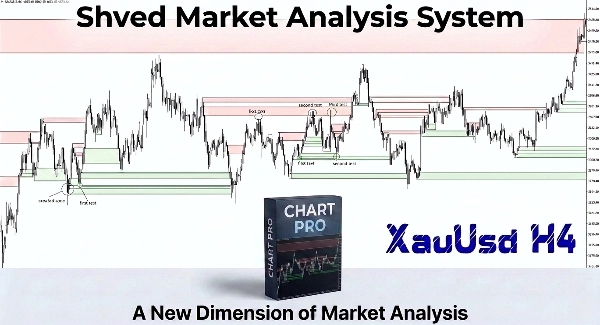
مؤشر SMAS Chart Pro هو مكون أساسي من نظام تحليل السوق شفيد (SMAS). إنه أداة تحليلية احترافية لمنصة cTrader، مصممة للكشف التلقائي والتتبع الديناميكي لمناطق العرض والطلب القوية مباشرة على مخطط السعر الخاص بك.
تم بناء هذا المؤشر على خوارزمية العرض والطلب الخاصة بشفيد، والتي يثق بها آلاف المتداولين حول العالم. تتميز النسخة الاحترافية لـ cTrader بخوارزمية كشف مناطق معاد تصميمها بالكامل وعالية التقنية مكتوبة بلغة C# مع تحسين عميق للأداء لهندسة cTrader Automate.
المؤشر متعدد الاستخدامات للغاية: بفضل تحسين الكود المتقدم، فهو مناسب تمامًا لكل من التداول السريع داخل اليوم (أطر زمنية M1 و M5) والتداول الموضعي طويل الأجل أو الاستثمار (H4، يومي، والفواصل الزمنية الأعلى).
المزايا الرئيسية لإصدار cTrader:
- خوارزمية مملوكة محمية: جميع نسب الكشف الأساسية تعمل تلقائيًا عبر أي أصل. المعلمات مخفية داخل الكود لحماية الملكية الفكرية.
- ضبط شفافية المنطقة: يسمح لك معلمة مخصصة بضبط شفافية تعبئة المنطقة (القيم الموصى بها بين 25 و 40). هذا يحافظ على وضوح الشموع وخطوط الشبكة بشكل مثالي على كل من سمات المخطط الفاتحة والداكنة.
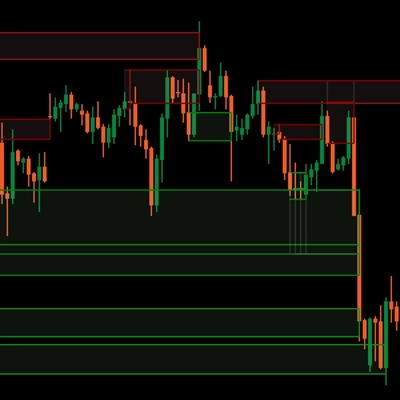
- تتبع التخفيف الديناميكي: تبقى المنطقة نشطة وتمتد إلى اليمين حتى يكسر السعر حدها الأقصى (قاعدة "كسر كلا المستويين"). بمجرد أن يمتص السعر الحاجز الحدّي بالكامل، يتم تعطيل المستوى.
- عرض الاختبار والتفاعل التاريخي: يمكنك تمكين عرض المناطق المكسورة (إظهار المناطق غير الصالحة). تبقى على المخطط كخطوط رفيعة، تتغير ألوانها لتطابق القاعدة، مما يسمح لك بتحليل الارتدادات التاريخية بصريًا.
- أداء عالي: الكود مكتوب بلغة C# نظيفة (.NET) مع تقليل التداخل المعتمد على المؤقت، مما يضمن تحميل المخطط الفوري وعدم وجود تأخير حتى في إطار M1 الزمني.
توصيات التداول:
مناطق العرض والطلب هي مناطق مثالية لإيجاد نقاط الدخول عند إعادة اختبار المستويات مع مخاطر منخفضة. عادةً ما يتم وضع وقف الخسارة فقط خارج الحد الخارجي المعاكس للقاعدة، مما يضمن وقفًا ضيقًا ونسبة مخاطرة/مكافأة عالية لصفقاتك.
==================================================
РУССКИЙ ПЕРЕВОД / RUSSIAN VERSION
==================================================
Индикатор SMAS Chart Pro является важной частью торговой системы Shved Market Analysis System (SMAS). Это профессиональный аналитический инструмент для платформы cTrader, предназначенный для автоматического поиска и динамического ведения сильных зон спроса и предложения (Supply & Demand) непосредственно на вашем ценовом графике.
Этот индикатор создан на базе оригинального алгоритма Shved Supply and Demand, который завоевал доверие тысяч трейдеров. Версия Pro для cTrader получила полностью переработанный, высокотехнологичный алгоритм поиска зон, написанный на C# с глубокой оптимизацией производительности под архитектуру cTrader Automate.
Индикатор универсален: благодаря оптимизации кода он подходит как для внутридневного скальпинга (на таймфреймах M1 и M5), так и для долгосрочного позиционного трейдинга и инвестирования (на H4, Daily и старших интервалах).
Оригинальный алгоритм фильтрации шума:
Главное отличие индикатора от большинства стандартных программ заключается в его математическом ядре сканирования. Стандартные индикаторы часто отмечают любые случайные развороты цены или фракталы. SMAS Chart Pro использует фильтр рыночного шума: он оценивает скорость и импульс резкого выхода цены относительно размера и волатильности самого диапазона накопления ордеров.
Алгоритм математически вычисляет, был ли ценовой разворот результатом институциональной проторговки с нереализованным лимитным объемом или это обычный хаотичный шум. Это позволяет отсеивать слабые уровни, оставляя на графике только те зоны, от которых цена с высокой вероятностью получит сильную реакцию.
Модели поиска Price Action:
Алгоритм сканирует график на предмет формирования четырех классических моделей Price Action:
- Rally-Base-Rally (RBR) и Drop-Base-Rally (DBR) — для зон спроса (покупок / Demand).
- Drop-Base-Drop (DBD) и Rally-Base-Drop (RBD) — для зон предложения (продаж / Supply).
Каждый паттерн строго оценивается по пропорциям силы первоначального импульса, размера и длительности ценовой консолидации, а также скорости последующего выхода цены из этого диапазона.
Ключевые преимущества версии для cTrader:
- Защищенный авторский алгоритм: Все пропорции поиска баз настроены профессионально и работают автоматически на любых инструментах. Параметры скрыты внутри кода для защиты интеллектуальной собственности.
- Регулировка прозрачности (Zone Opacity): Специальный параметр позволяет настроить прозрачность заливки зон (рекомендуемое значение — от 25 до 40). Это позволяет сохранить полную четкость свечей и сетки графика на любой теме терминала (светлой или темной).
- Динамическое ведение зон (Mitigation): Зона остается полностью активной и продлевается вправо, пока цена не пробьет её экстремум (правило Break Both Levels). Как только цена полностью поглощает лимитный барьер, уровень деактивируется.
- История тестов и реакций: Вы можете включить отображение пробитых зон (Show Invalid Zones). Они останутся на графике в виде тонких линий, изменив цвет на цвет базы, что позволит наглядно оценивать историю отскоков.
- Высокая производительность: Код написан на чистом C# (.NET) и оптимизирован для стабильной работы даже при анализе глубокой истории баров.
الملخص
Key features include automatic zone detection with protected algorithm parameters, adjustable zone opacity for clear visualization on different chart themes, and dynamic mitigation tracking where zones remain active until price breaks their boundaries. It also offers a historical view of broken zones to analyze past price reactions. The algorithm filters market noise by evaluating price impulse strength, consolidation size, and volatility to highlight only significant zones likely to influence price action.
The indicator scans for four classic Price Action patterns—Rally-Base-Rally, Drop-Base-Rally, Drop-Base-Drop, and Rally-Base-Drop—to identify demand and supply zones. These zones serve as potential entry points with defined stop loss placement beyond opposite boundaries, aiming for favorable risk/reward ratios. SMAS Supply Demand Chart Pro is designed for use on any asset and integrates smoothly within the cTrader Automate environment.