
说明
🎯 多时间框架波动率智能
别再错过波动率突破——同时查看所有时间框架
大多数波动率指标只显示一个视角。我们的 多时间框架滚动波动率指标 为您提供短期(7)、中期(21)和长期(63)周期的完整图景——配备 内置交易信号,准确告诉您何时行动。
⚡ 为什么多时间框架波动率改变一切
单一时间框架 vs 我们的多时间框架方法:
- ❌ 单一周期:只见树木,未见森林
- ✅ 三个周期:带有背景的完整波动率全景
真实交易场景:
- 短期波动激增 而长期平静 → 临时噪音(忽略)
- 所有时间框架波动上升 → 真正的市场状态变化(行动)
- 短期平静 而长期混乱 → 假象平静(谨慎)
🎯 专业功能
✨ 三重时间框架可视化
- StdDev 7:捕捉即时波动变化(盘中)
- StdDev 21:中期波动率(波段交易)
- StdDev 63:长期波动率背景(持仓交易)
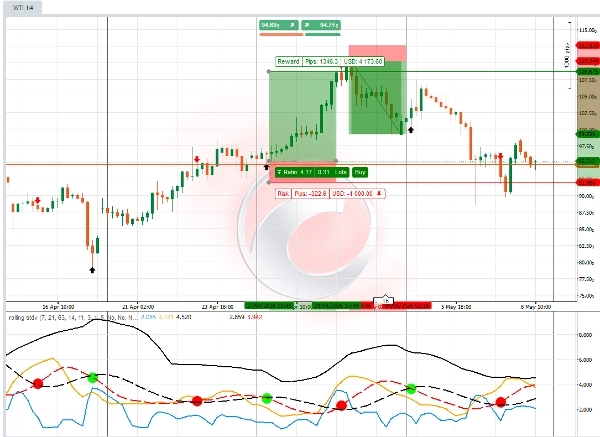
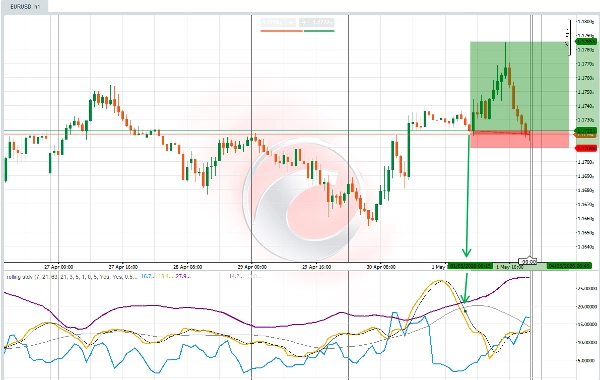
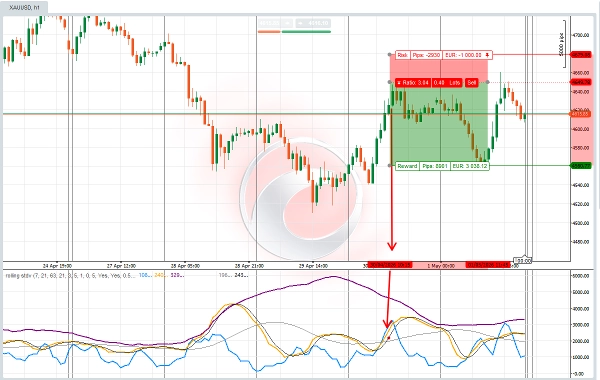
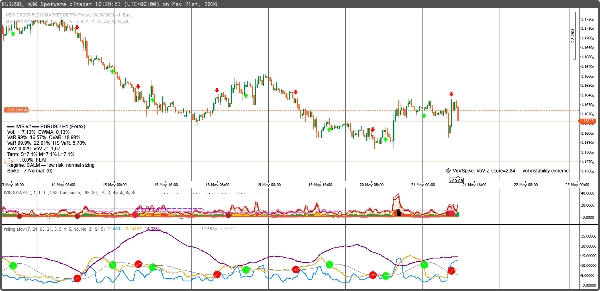
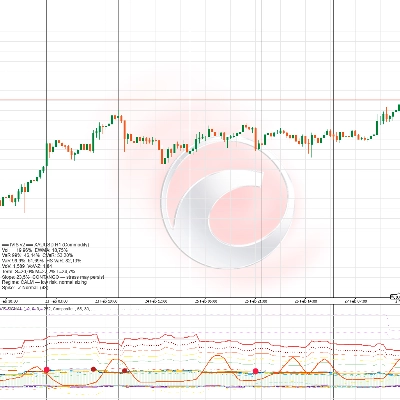
- 振荡器信号:当平均 滚动标准差信号线交叉时,彩色点确认更高和更低的波动率及价格走势方向。配合大型红点、绿点信号,交易者还将在图表上看到红箭头、绿箭头信号,帮助决定入场点位和交易规模。
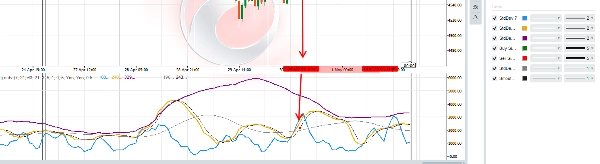
- 滚动标准差是一种带有预测市场信号逻辑的波动率振荡器。面板上的参数需根据交易者想交易的CFD工具类型进行检查和调整。每种金融资产CFD工具的面板设置可能略有不同。交易者可以通过激活:斜率、快/中交叉信号和平滑功能,选择波动率读数的准确性和精度。
📊 高级波动率分析
- 波动率交叉:StdDev线交叉 = 市场状态变化
- 均值回归信号:波动率回归均值
- 波动峰值检测:极端波动事件
💡 适合以下交易风格:
🎯 波动率突破交易者
- 在爆发性行情前低波动时入场
- 在高波动时出场,防止反转
- 使用三重确认精准把握入场时机
📈 均值回归交易者
- 自信地对冲波动极端
- 识别过度延伸的市场状况
- 将波动率用作逆向指标
🛡 风险规避型交易者
- 完全避免高波动期
- 仅在平稳、可预测的市场中交易
- 将波动率用作 仓位规模指导
📊 期权交易者
- 高波动时卖出时间价值
- 波动率压缩时买入期权
- 隐含波动率与历史波动率分析误价
内置智能信号:
- ✅ 买入时机:波动率低于阈值或跌破移动平均线时
- ✅ 卖出时机:波动率高于阈值或突破移动平均线时
📈 您将获得:
✅ 三重时间框架可视化 - 不再猜测波动率背景
✅ 自动买卖信号 - 最佳点位清晰箭头提示
✅ 波动率状态检测 - 了解市场何时平静或混乱
✅ 可定制阈值 - 适应任何交易风格或资产
✅ 专业颜色编码 - 即时视觉理解
💰 特别推出价:$50
(原价:$100)
价值明细:
- StdDev 7 指标:价值$29
- StdDev 21 指标:价值$29
- StdDev 63 指标:价值$29
- 交易信号:价值$49
- 总价值:$136
- 您的价格:$50(节省35%)
包含:完整指标 颜色
🎁 赠品:免费波动率时机指南
购买即赠送 “多时间框架波动率精通” - 价值$39,免费赠送。
包含内容:
- 波动率压缩交易策略
- 多时间框架确认技术
- 波动期风险管理
- 真实交易案例
🚀 准备好掌握波动率时机了吗?
点击“加入购物车”,改变您看待和交易市场波动率的方式。
“我尝试过所有波动率指标。这种带内置信号的三重时间框架方法是我在自营交易中每天使用的。”
- Sarah Rodriguez,专业波段交易员
适合以下市场:
📊 股票与ETF
- SPY、QQQ波动率时机
- 基于波动率的行业轮动
- 财报波动率交易
💹 外汇货币对
- 主要货币对波动率分析
- 套息交易风险评估
- 突破确认
📈 大宗商品
- 黄金波动周期
- 石油波动峰值
- 农产品季节性波动
🔄 加密货币
- BTC/ETH波动率状态
- 山寨币波动机会
- 加密货币风险管理
总结:这不仅仅是另一个标准差指标。这是一个完整的波动率时机系统,准确显示市场即将变动的时刻。
限时推出优惠:前150份售价$89(节省$30)
“业余与专业交易的区别往往在于波动率时机。这个指标弥补了这一差距。”
立即加入购物车 → 像专业人士一样开始交易波动率。
摘要
AI 摘要
The "rolling stdv" indicator is a multi-timeframe rolling volatility tool designed to provide comprehensive volatility analysis across short-term (7 periods), medium-term (21 periods), and long-term (63 periods) timeframes. It offers traders a complete view of market volatility dynamics, enabling better identification of volatility breakouts and regime changes. The indicator includes built-in trading signals that generate visual buy and sell arrows based on the crossing of rolling standard deviation lines, helping traders time entries and exits with precision.
Key features include:
- Triple timeframe visibility for immediate, swing, and position trading contexts.
- Volatility crossovers signaling regime shifts.
- Mean reversion and spike detection for volatility extremes.
- Customizable parameters to adapt to different CFD instruments and trading styles.
- Professional color-coded signals for quick interpretation.
This indicator suits various trading styles, including volatility breakout, mean reversion, risk-averse, and options trading. It supports multiple markets such as stocks, ETFs, forex pairs, commodities, and cryptocurrencies, providing volatility timing insights for assets like SPY, QQQ, gold, oil, BTC, and ETH.
Included with the indicator is a volatility timing guide covering compression strategies, multi-timeframe confirmation, risk management, and real trade examples. The tool requires tick data and outputs actionable signals to enhance volatility-based trading decisions.
指标配置
指标分类
波动性
输出类型
信号
数据要求
跳动点数据
支持的信号
交叉
背离
波动性
反转
客户评价
4.5
评价:2
5 | 50 % | |
4 | 50 % | |
3 | 0 % | |
2 | 0 % | |
1 | 0 % |
讨论
常见问答
Volume
Moving Average
cTrader Store 提供的所有产品,包括交易机器人、指标和插件,均由第三方开发者提供,仅供信息参考和技术访问之用。cTrader Store 并非经纪商,不提供投资建议、个人推荐或任何未来业绩保证。
该作者的其他作品


价格
49
销售
306
免费安装