
Descrição
O Oscilador de Volatilidade Condicional é um indicador técnico de nível institucional projetado para traders profissionais que exigem precisão na gestão de risco e dimensionamento de posições. Ao contrário dos indicadores de volatilidade padrão (como ATR ou Bandas de Bollinger), utiliza modelos puramente reativos e defasados, esta ferramenta (modelos Autoregressive Conditional Heteroskedasticity) modela a volatilidade futura com base no agrupamento de mercado e mudanças de regime. Este Oscilador é muito mais do que você imagina, requer conhecimento quantitativo de como a volatilidade funciona nos mercados, troca de regime e Valor em Risco, tudo funcionando com leitura ao vivo do spread, direção preditiva da posição e dimensionamento.
democratizando
Por anos, a previsão sofisticada de volatilidade condicional usando modelos GARCH esteve disponível exclusivamente para fundos de hedge e empresas de investimento dispostas a pagar milhares de dólares em assinaturas mensais de dados, taxas de licenciamento white-label e custos de software proprietário. Essas barreiras institucionais mantiveram os traders de varejo em desvantagem, dependendo de indicadores básicos defasados enquanto mesas profissionais negociavam com modelos preditivos de volatilidade. O Oscilador de Volatilidade GARCH muda tudo. Agora, por um único pagamento acessível, qualquer trader cTrader pode acessar a mesma classe de previsão estatística de volatilidade, detecção de regime e cálculos de Valor em Risco que antes eram reservados para quants de Wall Street. Sem assinaturas mensais. Sem requisitos mínimos de capital. Sem taxas de licenciamento white-label. Apenas ferramentas profissionais de gestão de risco e dimensionamento de posições diretamente no seu gráfico, para inteligência institucional de código aberto para o trader de varejo moderno.
Isto não é apenas um oscilador; é um completo Sistema de Previsão de Volatilidade e Dimensionamento de Posições.
Modelagem Avançada GARCH (GARCH, EGARCH, GJR-GARCH)
- Modelo GJR-GARCH(1,1): Utiliza o modelo Glosten-Jagannathan-Runkle, que é superior na captura do "efeito alavanca" (resposta assimétrica da volatilidade a choques negativos versus positivos).
- Motor de Volatilidade Híbrido: Combina previsão GARCH com um EWMA (Média Móvel Exponencialmente Ponderada) sistema de reserva para garantir leituras robustas mesmo durante anomalias extremas do mercado.
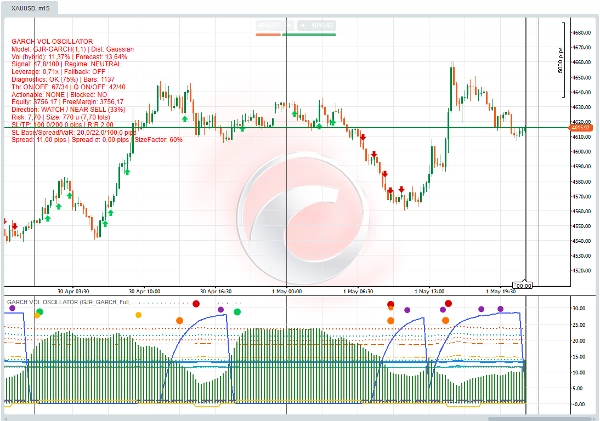
- Previsão Preditiva: Exibe uma previsão de volatilidade prospectiva (por exemplo, Previsão: 13,6%), marca permitindo que você antecipe expansão ou contração antes que aconteça.
Detecção Dinâmica de Regime de Mercado
- Classificação de Regime: Identifica automaticamente o estado atual do mercado (por exemplo, NEUTRO, ALTA VOL, BAIXA VOL).
- Sinais de Risco: Marca claramente ambientes "Risk On" e "Risk Off".
-
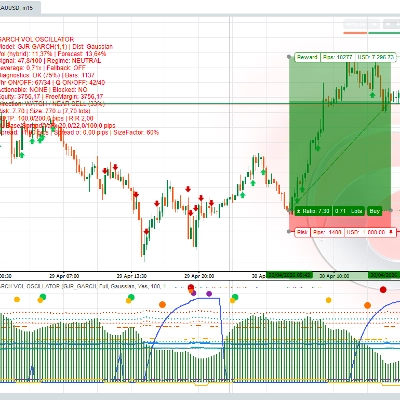
- Setas Verdes: Indicam baixa volatilidade, estabilidade de tendência ou ambientes "Risk On" favoráveis para posições maiores.
- Setas Vermelhas: Indicam alta volatilidade, potenciais reversões ou ambientes "Risk Off" que exigem cautela.
- Sistema de Alerta Precoce: Detecta sinais direcionais precoces e picos de volatilidade antes que a ação do preço os confirme completamente.
Dimensionamento Institucional de Posições e Gestão de Risco
- Calculadora Dinâmica de Alavancagem: O indicador calcula a alavancagem ótima (0,7x) com base na volatilidade atual e no patrimônio da sua conta.
- Dimensionamento Automático de Lotes: Sugere tamanhos precisos de lote (por exemplo, 1 lote) para manter um perfil de risco consistente independentemente das condições do mercado.
- Valor em Risco (VaR): Integra VaR estatístico (níveis de confiança de 95% e 99%) e CVaR (Valor Condicional em Risco) para definir limites de pior cenário.
- Sugestões Inteligentes de SL/TP: Gera níveis dinâmicos de Stop Loss e Take Profit baseados em múltiplos de volatilidade (por exemplo, SL/TP: 100,0/200,0 pips).
Painel Visual Abrangente
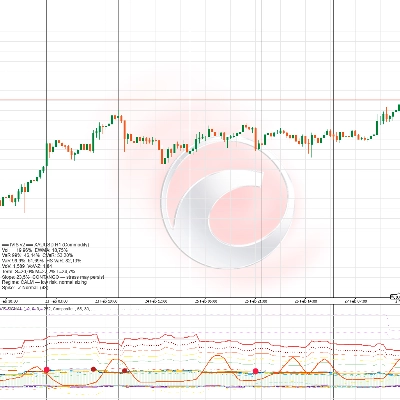
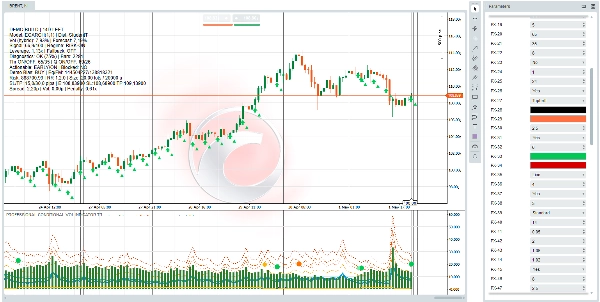
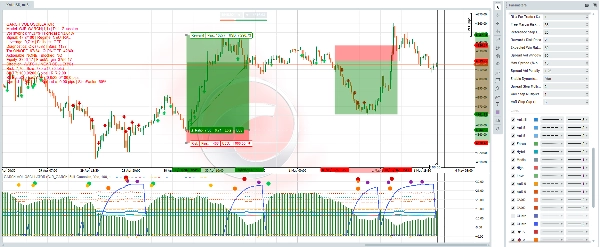
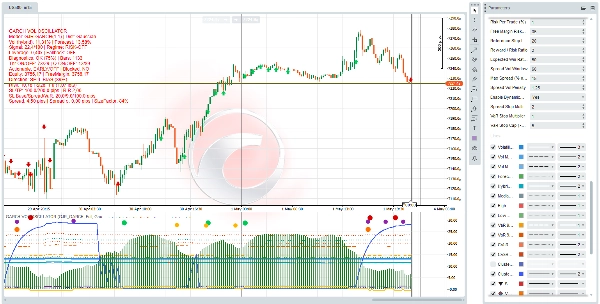
- Painel de Informações: Um painel de texto detalhado (canto superior esquerdo) fornecendo diagnósticos em tempo real, força do sinal, sugestões de alavancagem e métricas de risco da conta.
- Histograma de Volatilidade: mostrado agrupamento de volatilidade, ajudando você a ver períodos de calma versus turbulência instantaneamente.
- Pontos de Sinal: Maximize pontos (Roxo/Laranja/Verde/Vermelho) indicam sinais específicos de negociação, eventos de agrupamento e sinais bloqueados.
📊 Como Isso Ajuda Você a Negociar
- Evite Quebras: Ao detectar regimes "Risk Off" e picos de alta volatilidade, o indicador ajuda você a reduzir o tamanho ou ficar fora do mercado durante condições perigosas.
- Entradas Precisam: Os sinais "Quase Venda" ou "Quase Compra" no painel de informações dão um aviso prévio sobre potenciais reversões baseadas no esgotamento da volatilidade.
⚙️ Especificações Técnicas e Personalização
Este indicador é altamente configurável para se adequar ao seu estilo de negociação específico e apetite de risco:
- Parâmetros do Modelo: Iterações GARCH ajustáveis, tipos de distribuição (Gaussiana, Student-t) e períodos de aquecimento.
- Configurações de Risco: % de Volatilidade Alvo personalizável, limites mínimos/máximos de alavancagem e limites de risco de margem livre.
- Visuais: Setas de tendência ativáveis, realces no histograma e esquemas de cores personalizáveis para todas as linhas de sinal.
- Diagnósticos: Verificações internas de saúde do modelo (por exemplo, Diagnósticos: OK (75%)) para garantir que o modelo estatístico seja válido para os dados atuais.
Perfeito para: Traders algorítmicos, traders de swing e gestores de risco que buscam uma vantagem estatística no dimensionamento de posições.
Baixe o Oscilador de Volatilidade GARCH hoje e negocie com a precisão de um fundo quant.
© Direitos Autorais e Aviso Legal
© Datarum Algorithmica. Todos os Direitos Reservados.
O Oscilador de Volatilidade Condicional, incluindo todos os algoritmos subjacentes, código-fonte, designs visuais e propriedade intelectual, é propriedade exclusiva da Datarum Algorithmica. Reprodução, distribuição, modificação ou engenharia reversa não autorizadas deste software são estritamente proibidas.
Aviso de Risco:
Negociar nos mercados financeiros envolve risco substancial de perda e não é adequado para todos os investidores. A avaliação de futuros, ações, opções e CFDs (Contratos por Diferença) pode flutuar, e como resultado, os clientes podem perder mais do que seu investimento original. A compra e uso do Oscilador de Volatilidade GARCH são de responsabilidade e risco exclusivos do cliente. A Datarum Algorithmica não se responsabiliza por quaisquer perdas de negociação incorridas ao usar este software. Ao adquirir este indicador, você reconhece que é responsável por suas próprias decisões de negociação, gestão de risco e resultados financeiros. O desempenho passado do indicador não é indicativo de resultados futuros. Por favor, certifique-se de compreender completamente os riscos associados à negociação de CFDs antes de entrar no mercado.
DATARUM ALGORITHMICA é uma equipe de desenvolvimento especializada focada na criação de algoritmos avançados de negociação e indicadores técnicos para plataformas modernas de gráficos. Nossas ferramentas são projetadas estritamente para análise técnica e fins educacionais, fornecendo aos traders visualização precisa da estrutura do mercado e cálculos automatizados. Não oferecemos aconselhamento financeiro, recomendações de investimento ou sinais de negociação. Todo o software é fornecido como uma utilidade técnica, e quaisquer decisões de negociação executadas usando nossos indicadores permanecem sob a responsabilidade exclusiva do usuário. Por favor, negocie com responsabilidade e sempre realize pesquisas independentes.
— EQUIPE DE DESENVOLVIMENTO DATARUM ALGORITHMICA
© Todos os Direitos Reservados à DATARUM ALGORITHMICA
Resumo
Key features include dynamic market regime detection with automatic classification of volatility states (Neutral, High Volatility, Low Volatility) and risk signals ("Risk On" and "Risk Off") indicated by colored arrows. The indicator integrates a dynamic leverage calculator and auto-lot sizing to optimize position sizes based on current volatility and account equity. It also incorporates Value at Risk (VaR) and Conditional VaR metrics for statistical risk boundaries, alongside smart stop loss and take profit suggestions derived from volatility multiples.
A comprehensive visual dashboard provides real-time diagnostics, signal strength, volatility histograms, and trade signal dots to assist in precise entries and risk assessment. The indicator is highly configurable, allowing customization of model parameters, risk settings, and visual elements to suit individual trading styles.
Designed for algorithmic traders, swing traders, and risk managers, this tool offers professional-grade volatility forecasting, regime detection, and position sizing directly on trading charts, enabling more informed trading decisions.
Conversa
Avaliações de clientes
5 | 0 % | |
4 | 100 % | |
3 | 0 % | |
2 | 0 % | |
1 | 0 % |