

Money Flow Profile
Chỉ báo
Phiên bản 1.0, Jul 2026
Windows, Mac

534.4M
Khối lượng đã giao dịch
9.76M
Pip đạt được
4
Lượt bán
Mô tả
📊 Hồ Sơ Dòng Tiền
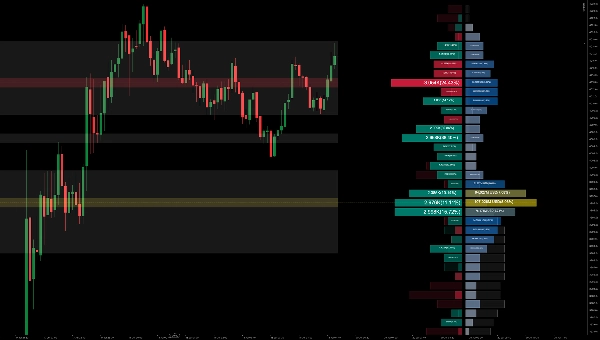
Hồ Sơ Dòng Tiền là một công cụ biểu đồ nâng cao đo lường khối lượng giao dịch hoặc dòng tiền tại tất cả các mức giá trên thị trường trong một khoảng thời gian xác định. Nó làm nổi bật mối quan hệ giữa giá tài sản và sự sẵn lòng của các nhà giao dịch mua hoặc bán, cho phép bạn:
- Tiết Lộ Các Mức Giá Chính: Dễ dàng xác định các cụm khối lượng và các nút thanh khoản cao như Điểm Kiểm Soát (POC).
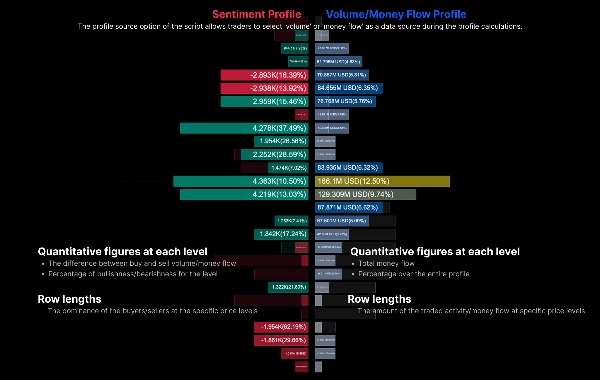
- Phân Tích Tâm Lý Thị Trường: Bằng cách hiển thị Hồ Sơ Tâm Lý bên trái và Hồ Sơ Khối Lượng bên phải, nó xác định liệu người mua hay người bán đang chiếm ưu thế ở mỗi mức giá cụ thể.
- So Sánh Qua Các Giai Đoạn: So sánh trực tiếp hồ sơ hiện tại với hồ sơ bóng của giai đoạn trước để quan sát sự dịch chuyển trọng tâm của thị trường.
⚙️ Tham Số Cốt Lõi & Hướng Dẫn Sử Dụng
1. Cài Đặt Chung
- Độ Dài Quay Lại / Phạm Vi Cố Định: Xác định số lượng thanh lịch sử được sử dụng để tính hồ sơ (ví dụ: 200 thanh cuối).
- Nguồn Dữ Liệu:
-
1 = Khối Lượng: Tính hồ sơ dựa trên khối lượng tick/giao dịch truyền thống.2 = Dòng Tiền: Kết hợp độ sâu giá để tính phân phối dòng tiền.
2. Cài Đặt Hồ Sơ
- Độ Phân Giải Hàng (Hàng): Xác định độ chi tiết của trục dọc. Số cao hơn (ví dụ: 50-100) cho kết quả hồ sơ chi tiết hơn.
- Chiều Rộng Hồ Sơ & Độ Dịch Ngang: Điều chỉnh độ rộng của hồ sơ được vẽ (theo phần trăm) và khoảng cách dịch sang phải, tránh chồng lấn với cây nến hiện tại.
3. Tâm Lý & Hiển Thị
- Cực Tâm Lý:
-
1 = Nến: Xác định tâm lý tăng/giảm chỉ dựa trên giá mở và đóng của nến (cực tính).2 = Áp Lực Mua/Bán: Sử dụng phép tính chính xác hơn, tính đến bấc nến và giá đóng so với cao/thấp.
- Hiển Thị Hồ Sơ Tâm Lý / Hồ Sơ Khối Lượng: Các công tắc độc lập để hiển thị hồ sơ tâm lý ròng (Bên Trái) và hồ sơ khối lượng chính (Bên Phải).
- Hiển Thị Giai Đoạn Trước: Khi bật, nó vẽ một hồ sơ "Thanh Bóng Ma" nền đại diện cho cùng khoảng thời gian của giai đoạn trước. Rất hữu ích để theo dõi sự dịch chuyển hỗ trợ/kháng cự.
4. Hiển Thị Khu Vực Mở Rộng
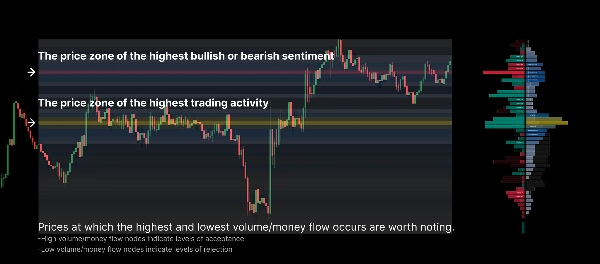
- Hiển Thị Bản Đồ Nhiệt: Chiếu mật độ hồ sơ trên toàn bộ khoảng thời gian tính toán dưới dạng bản đồ nhiệt nền. Bạn có thể chọn chiếu "Khối Lượng" hoặc "Tâm Lý".
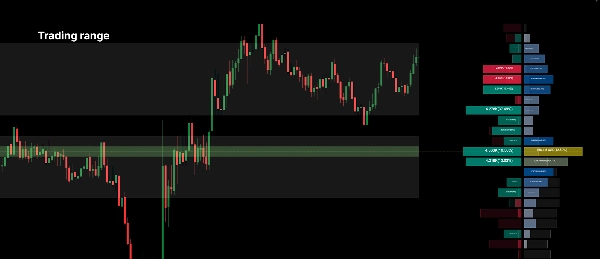
- Hiển Thị Khu Vực Giá Trị: Làm nổi bật phạm vi giá cốt lõi nơi phần lớn khối lượng giao dịch diễn ra. Ngưỡng có thể tùy chỉnh (ví dụ: 70%).
- Hiển Thị Vùng POC: Tự động vẽ một đường ngang và vùng tại Điểm Kiểm Soát (mức giá có khối lượng cao nhất) cho phạm vi đã chọn.
💡 Mẹo Giao Dịch Thực Tiễn:
- Tìm Các Nút Khối Lượng Cao (Đỉnh) để làm mức hỗ trợ hoặc kháng cự mạnh.
- Tìm Các Nút Khối Lượng Thấp (Thung Lũng), vì giá có xu hướng di chuyển nhanh qua các vùng thanh khoản thấp này.
- Sử dụng Hồ Sơ Bóng Ma Giai Đoạn Trước: Nếu POC hiện tại (đường màu vàng) hình thành cao hơn POC của giai đoạn trước, điều đó cho thấy sự đồng thuận giá trị đang dịch chuyển lên trên, thường là tín hiệu tăng giá.
Tóm tắt
AI summary
Money Flow Profile is an advanced indicator that maps traded volume and market sentiment across price levels over a specified time period. It visualizes the relationship between price and trader activity, highlighting key liquidity zones such as volume clusters and the Point of Control (POC). The tool displays a Sentiment Profile on the left and a Volume Profile on the right, enabling users to assess whether buyers or sellers dominate at each price level. It supports direct comparison with the previous period’s profile via a ghost overlay to track shifts in market value consensus.
Core configurable parameters include lookback length, data source selection (volume or money flow), row resolution for vertical granularity, profile width and offset, and sentiment polarity calculation methods (candle-based or buy/sell pressure). Display options allow toggling of sentiment and volume profiles, previous period overlays, heatmaps of volume or sentiment density, value area highlighting, and automatic POC zone marking.
The indicator is designed to help identify strong support and resistance levels at high volume nodes and anticipate rapid price movements through low volume nodes. It supports detailed volume and sentiment analysis to inform trading decisions based on liquidity and market structure.
Core configurable parameters include lookback length, data source selection (volume or money flow), row resolution for vertical granularity, profile width and offset, and sentiment polarity calculation methods (candle-based or buy/sell pressure). Display options allow toggling of sentiment and volume profiles, previous period overlays, heatmaps of volume or sentiment density, value area highlighting, and automatic POC zone marking.
The indicator is designed to help identify strong support and resistance levels at high volume nodes and anticipate rapid price movements through low volume nodes. It supports detailed volume and sentiment analysis to inform trading decisions based on liquidity and market structure.
Hồ sơ chỉ báo
Danh mục chỉ báo
Khối lượng
Loại đầu ra
Hình ảnh trực quan
Yêu cầu dữ liệu
Khối lượng
DoM
Chỉ dữ liệu nến
Dữ liệu tick
Tín hiệu được hỗ trợ
Phá vỡ giá
Sức mạnh xu hướng
Đảo chiều
Biến động
Chạm ngưỡng
Phá ngưỡng
Đánh giá của khách hàng
0.0
Đánh giá: 0
Đánh giá của khách hàng
Sản phẩm này chưa có đánh giá nào. Bạn đã dùng thử chưa? Hãy là người đầu tiên chia sẻ với mọi người!
Thảo luận
Câu hỏi thường gặp
Key Levels
Volume
Các sản phẩm có sẵn trên cTrader Store, bao gồm bot giao dịch, chỉ báo và plugin, được cung cấp bởi các nhà phát triển bên thứ ba và chỉ nhằm mục đích cung cấp thông tin và tiếp cận kỹ thuật. cTrader Store không phải là nhà môi giới và không cung cấp lời khuyên đầu tư, khuyến nghị cá nhân hay bất kỳ đảm bảo nào về hiệu suất trong tương lai.
Sản phẩm khác của tác giả này






















Giá
534.4M
Khối lượng đã giao dịch
9.76M
Pip đạt được
4
Lượt bán