
Description
Market Structure Pro – Lignes de tendance, zones & entrées intelligentes
Market Structure Pro est une boîte à outils complète d'action des prix qui cartographie automatiquement la structure des oscillations du marché, les supports/résistances clés, les vraies lignes de tendance et les zones HH/LL — puis met en évidence en option des entrées de repli à haute probabilité avec une logique de confirmation intégrée.
Au lieu de tout dessiner à la main, l'indicateur analyse continuellement votre graphique en arrière-plan et maintient votre structure, vos zones et vos signaux à jour en temps réel.
Ce que fait cet indicateur
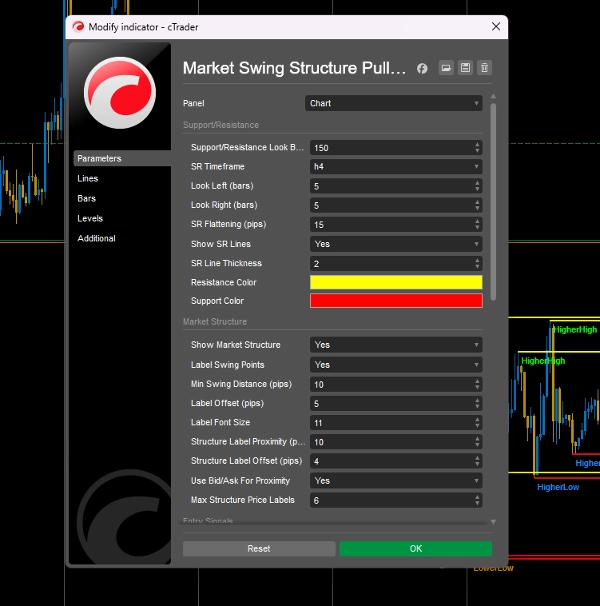
- Support & Résistance Automatiques
-
- Détecte les hauts/bas d'oscillation sur une plage de retour configurable.
- Aplati les niveaux proches en zones plus nettes en utilisant une tolérance en pips.
- Dessine des lignes SR interactives sur n'importe quelle unité de temps sélectionnée (ex. SR 4H sur entrées M15).
- Épaisseur et couleurs entièrement personnalisables pour le support et la résistance.
- Vraies Lignes de Tendance Extérieures
-
- Construit des lignes de tendance de support et résistance ascendantes/descendantes à partir de points d'oscillation validés.
- Contrôles pour limiter le nombre de lignes de tendance par direction affichées et pour les prolonger dans le futur.
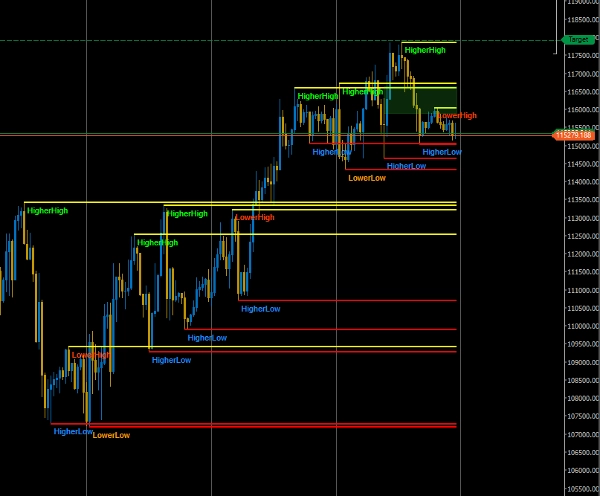
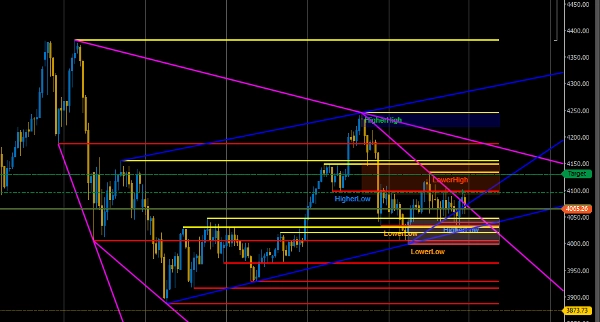
- Cartographie de la Structure du Marché (HH, HL, LH, LL)
-
- Étiquette directement sur le graphique les oscillations Higher High, Higher Low, Lower High, Lower Low.
- Distance minimale d'oscillation ajustable (en pips) pour éliminer le bruit du marché.
- Limite le nombre d'étiquettes actives pour garder votre graphique propre.
- Texte en direct affichant « Tendance actuelle » (hausse / baisse / latéral, avec notes de retournement).
- Message intégré « Prédiction de la prochaine structure » pour donner un contexte directionnel.
- Zones des Chandeliers Source HH/LL
-
- Dessine automatiquement des zones à partir des derniers chandeliers source Higher High et Lower Low.
- Trois modes de zone :
-
- Chandelier complet (haut ↔ bas)
- Corps seulement (plage ouverture/fermeture)
- Mèche seulement (mèche supérieure pour HH, mèche inférieure pour LL)
- Remplissage de zone (pips), opacité, couleur pour zones longues/courtes, et choix d'étendre les zones jusqu'à la barre actuelle.
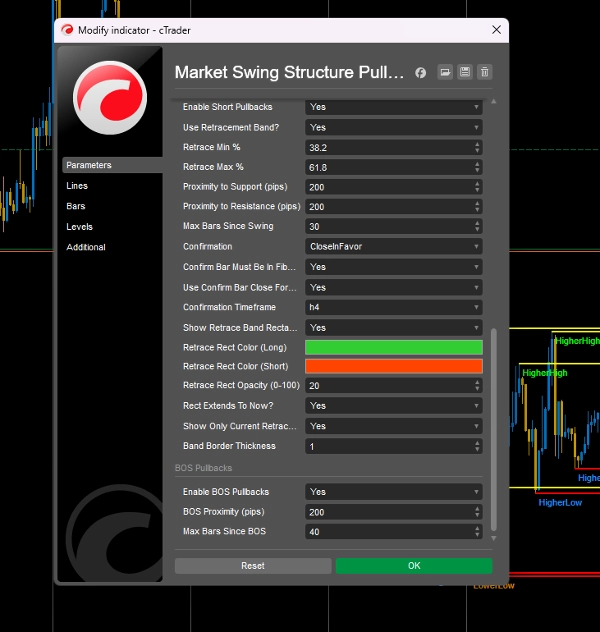
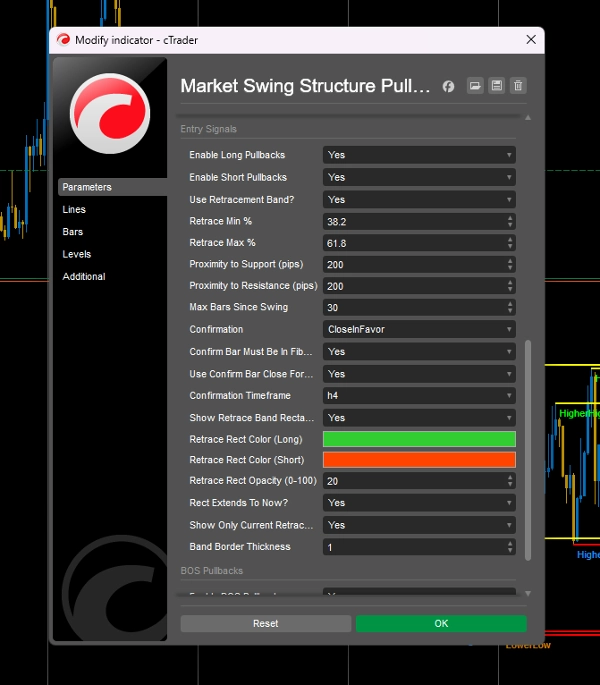
- Signaux d'entrée intelligents (optionnel)
-
- Interrupteur principal pour activer/désactiver tous les signaux d'entrée.
- Entrées de repli sur oscillation :
-
- Utilise la dernière jambe d'impulsion (HH–HL ou LH–LL).
- Construit une bande de retracement de style Fibonacci (ex. 38,2–61,8%) pour achats/ventes.
- Vérifie la proximité des points d'oscillation et des niveaux SR.
- Limite le nombre de barres après l'oscillation pendant lesquelles un signal reste valide.
- Replis Break-of-Structure (BOS) :
-
- Détecte les BOS via des cassures clés LH/HL.
- Recherche des retests du niveau BOS et des SR proches.
- Utilise des filtres séparés de proximité et de « barres depuis BOS ».
- Moteur de confirmation
-
- Modes de confirmation multiples pour les entrées :
-
- Fermeture uniquement en faveur
- Chandelier englobant uniquement
- Fermeture + Englobant
- Aucun (signaux bruts)
- Exigence optionnelle que le chandelier de confirmation soit également à l'intérieur de la bande de retracement.
- Unité de temps de confirmation séparée (ex. confirmer sur H4 tout en tradant en M15).
- Vous pouvez choisir d'utiliser la clôture de la barre de confirmation comme prix/heure réel du signal.
- Contrôles visuels & de performance
-
- Décalages d'étiquettes ajustables, taille de police, et nombre maximal d'étiquettes de structure.
- Opacité du rectangle, épaisseur de bordure, et comportement « étendre jusqu'à maintenant » pour les bandes et zones de retracement.
- Mises à jour basées sur un minuteur pour garder les calculs efficaces même sur des unités de temps inférieures.
Idéal pour
- Les traders d'action des prix qui s'appuient sur la structure du marché (HH/HL/LH/LL).
- Les traders swing et intraday qui veulent les SR et lignes de tendance des unités de temps supérieures visibles sur leur graphique d'entrée.
- Les traders cherchant des entrées de repli basées sur des règles autour des structures clés, zones et niveaux BOS avec des confirmations claires.
Comment utiliser
- Choisissez votre unité de temps SR (ex. H4) et la plage de retour.
- Activez Lignes de tendance et ajustez si vous souhaitez qu'elles soient prolongées et filtrées pour les gaps du weekend.
- Activez Structure du marché et les étiquettes pour voir HH/HL/LH/LL et la tendance/prédiction en direct.
- Activez Zones et choisissez votre mode de plage préféré (Complet, Corps, ou Mèche seulement).
- Si vous voulez des signaux, activez Signaux d'entrée, définissez votre bande de retracement (ex. 38,2–61,8%), les proximités et le comportement de confirmation.
Vous contrôlez toujours votre gestion des risques et votre exécution – Market Structure Pro vous offre un cadre structuré et visuel pour que vous puissiez vous concentrer sur la prise de décision, pas sur le dessin.
Résumé
It features auto-drawn zones based on the last Higher High and Lower Low source candles, with options for full candle, body only, or wick-only ranges. Smart entry signals include swing pullback entries using Fibonacci-style retracement bands and break-of-structure (BOS) pullbacks, both filtered by proximity and time since the swing or BOS event. A confirmation engine supports multiple modes such as close-in-favor, engulfing candles, or combined confirmations, with configurable confirmation timeframes and signal price options.
Visual and performance controls allow adjustment of label offsets, font sizes, opacity, and update frequency to maintain chart clarity and efficiency. Market Structure Pro supports various markets including Forex, indices, commodities, stocks, and cryptocurrencies, and is suitable for price-action, swing, and intraday traders seeking structured, rule-based analysis and entry signals without manual drawing.
Avis clients
5 | 33 % | |
4 | 67 % | |
3 | 0 % | |
2 | 0 % | |
1 | 0 % |


![Logo de "[Stellar Strategies] Smart ADX"](https://cdn.ctrader.com/image/webp/af13b084-b6f6-41db-b7bc-c7e688b57b05_36929)


