
Description
Indicateur Multi-Temps Quantitative Qualitative Estimation (QQE)
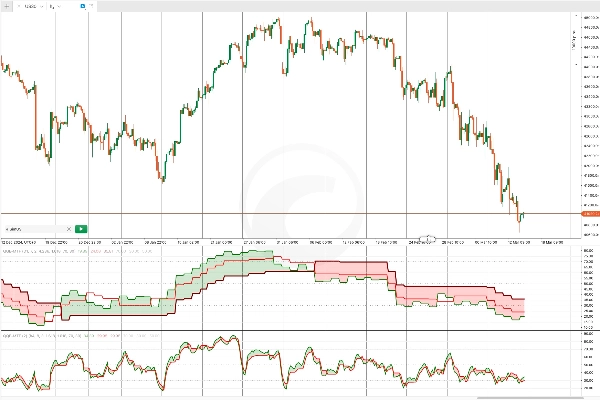
L’indicateur Quantitative Qualitative Estimation (QQE) est un outil d’analyse technique qui améliore le Relative Strength Index (RSI) en incorporant des moyennes mobiles lissées. Il aide les traders à évaluer la force de la tendance, les retournements potentiels et les conditions de surachat/survente avec une plus grande précision.
Le QQE comprend deux composants clés : les niveaux de stop suiveur rapide et lent, qui agissent comme des supports et résistances dynamiques. Cela en fait un outil polyvalent pour les stratégies de suivi de tendance et de retour à la moyenne. Un croisement entre la ligne QQE et sa ligne de signal indique souvent des opportunités potentielles d’achat ou de vente.
QQE Multi-Temps : Une Version Avancée
Cette version améliorée de l’indicateur QQE est conçue comme un outil multi-temps, intégrant à la fois des lignes de tendance rapides et lentes pour une meilleure précision. En analysant l’action des prix sur plusieurs périodes, il offre une vue complète des tendances du marché.
Son algorithme de lissage avancé renforce sa fiabilité, en faisant un indicateur autonome efficace pour :
✅ Identifier la direction de la tendance
✅ Générer des signaux d’entrée et de sortie précis
✅ Détecter les conditions de surachat et de survente
La flexibilité du QQE Multi-Temps le rend adapté aux stratégies de suivi de tendance et de retournement.
Comment Utiliser le QQE Multi-Temps
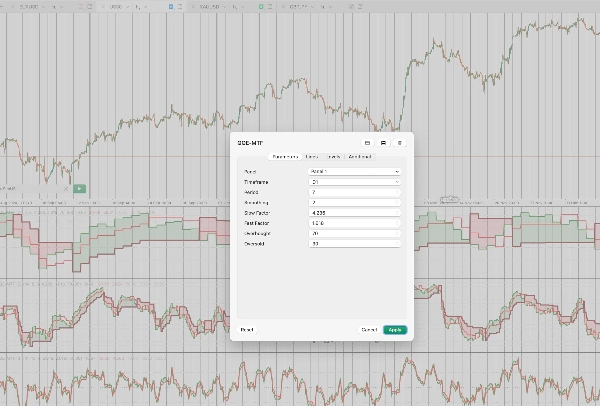
Pour configurer le QQE Multi-Temps, les traders doivent sélectionner :
🔹 Une période (par exemple, Daily, H4, H1)
🔹 Les périodes (nombre de chandeliers utilisés dans le calcul)
🔹 Une période de lissage (pour le lissage du RSI)
🔹 Facteurs lent et rapide (pour ajuster la sensibilité)
🔹 Niveaux personnalisables de surachat et de survente
📌 Note : Étant donné qu’il s’agit d’un indicateur multi-temps, après l’avoir ajouté au graphique, il est essentiel de dézoomer dans l’interface cTrader pour permettre le chargement suffisant des données et l’initialisation correcte de l’indicateur.
Stratégies de Trading avec le QQE Multi-Temps
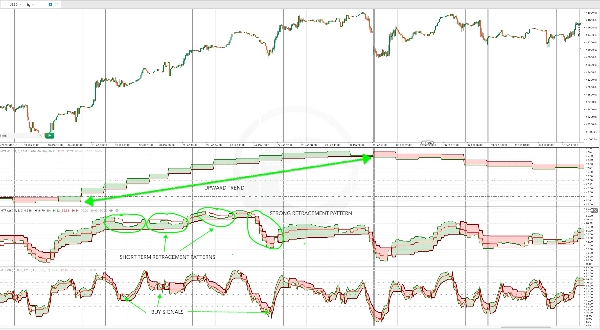
1️⃣ QQE pour la Confirmation de Tendance sur une Période Élevée
Une façon efficace d’utiliser le QQE Multi-Temps est pour la confirmation de tendance sur une période plus élevée tout en identifiant les entrées de retracement sur une période plus basse.
Par exemple :
- Le QQE sur la période quotidienne est utilisé pour confirmer une tendance forte.
- Les entrées de retracement sont ensuite identifiées lorsque l’Oscillateur Stochastique franchit les niveaux de surachat ou de survente.
Cette méthode aide les traders à aligner leurs entrées avec la tendance générale.
2️⃣ Analyse Multi-Temps pour des Perspectives de Marché Approfondies
L’utilisation du QQE sur plusieurs périodes permet aux traders d’obtenir une compréhension plus détaillée du comportement d’un actif.
Par exemple, en appliquant le QQE sur :
📊 Période quotidienne (D1) : Détermine la direction générale de la tendance.
📊 Période de 4 heures (H4) : Confirme la direction de la tendance et identifie les replis à court terme.
📊 Période d’une heure (H1) : Génère des signaux d’entrée précis basés sur les conditions de surachat/survente ou les mouvements contre-tendance.
Cette approche structurée améliore le timing des trades et la prise de décision en alignant les signaux à travers différentes périodes.
Résumé
This advanced multi-timeframe tool integrates fast and slow trend lines to analyze price action across different timeframes, providing a comprehensive view of market trends. Its smoothing algorithm improves reliability, making it effective for identifying trend direction, generating precise entry and exit signals, and detecting overbought/oversold levels.
Users configure the indicator by selecting a timeframe (e.g., Daily, H4, H1), periods for calculation, smoothing period for RSI, sensitivity factors, and customizable overbought/oversold thresholds. It is recommended to zoom out in the cTrader interface after adding the indicator to allow sufficient data loading.
Typical strategies include using the QQE on higher timeframes for trend confirmation and on lower timeframes for entry timing, as well as multi-timeframe analysis to enhance trade timing and decision-making by aligning signals across timeframes.
Avis clients
5 | 50 % | |
4 | 50 % | |
3 | 0 % | |
2 | 0 % | |
1 | 0 % |


