説明
このアルゴリズムは高度な技術ツールです 🔧 幾何学的な価格パターン(ハーモニックパターン)の検出を自動化するために設計されており 価格アクションに基づく市場構造を解析します。主な目的は、高確率の潜在的なトレンド反転ゾーン 📍を特定することです。
https://chartshots.spotware.com/c/693330cd99c57
このアルゴリズムは何をするのか?
アルゴリズムはチャートをリアルタイムで 🔍 特定の価格形成を探してスキャンします。2つのレベルで動作します:
- 構造マッピング(ジグザグ):まず、市場のノイズを簡素化するために、関連する高値と安値(ピボット)を結ぶ「ジグザグ」ライン を描きます。最大4つの異なる長さを同時に 📏 使用して、小さな(短期)および大きな(長期)トレンドの両方を捉えます。
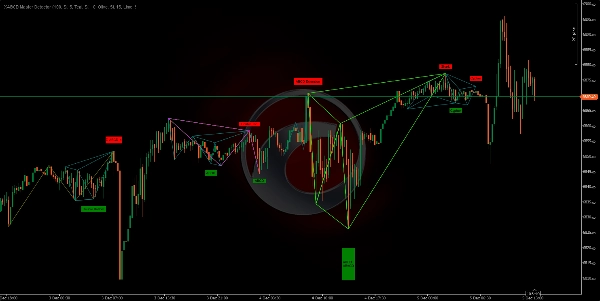
- パターン認識:これらのピボットポイント(A、B、C、D、X点)が特定されると、アルゴリズムはそれらの間の距離と比率を測定します。これらの比率が古典的な取引パターン(フィボナッチなど)の数学的ルールに一致すると、インジケーターはパターンを描画し、ユーザーに警告します 🚨。
何のために使うのか?
複雑なパターンを描く際の主観性を排除し 分析時間を節約する ⏳ために役立ちます。各フィボナッチのリトレースメントやエクステンションを手動で測定する代わりに、インジケーターが自動的に行います:
- 反転の検出:価格が反転する可能性のあるポイントを見つけます(強気から弱気、またはその逆)。 🔄
- エントリーポイントの特定:市場に入るための正確なゾーン(「潜在的反転ゾーン」)を示します。 🎯
- 分析の確認:自身のサポート/レジスタンス戦略に対する追加の根拠として機能します。
計算のロジック
インジケーターの核はフィボナッチ比率と市場の対称性 ⚖️に基づいています。アルゴリズムは各パターンに対して厳格なルールを検証します。例えば、「ガートレー」パターンを確認するために、アルゴリズムは内部で以下を計算します:
- B点のリトレースメントがXAレッグに対して正確に(または非常に近く)0.618であるかどうか。
- D点のプロジェクションが特定の比率を満たしているかどうか。
市場は正確なピップ単位で完璧であることは稀なため、インジケーターは小さな誤差の余地(設定可能) を許容します。また、パターンを表示する前に理論的なリスク/リワード比率 も計算します。
検出するパターン:
https://chartshots.spotware.com/c/6933314cb9fa1
- クラシック:ダブルトップとダブルボトム。 🏔️🏞️
- ハーモニック:ガートレー、バット 🦇、バタフライ 🦋、クラブ 🦀、ディープクラブ、シャーク 🦈、サイファー。
- ABCD構造:クラシックABCD、AB=CD、拡張ABCD。
- エキゾチック:スリードライブ、5-0。
https://chartshots.spotware.com/c/6933317ae4324
使い方は?
ビジュアルセットアップ:
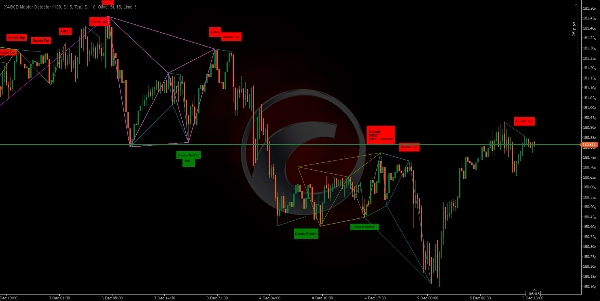
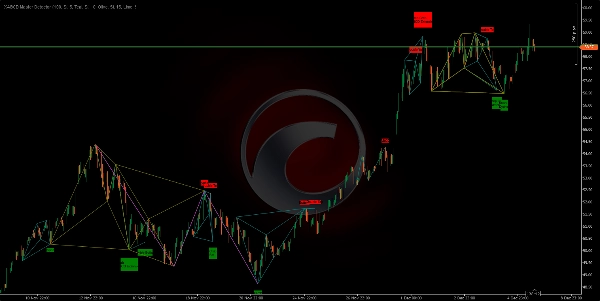
- ピークと谷を結ぶカラフルなライン が表示されます。
- パターンが完成すると、カラフルな幾何学図形とパターン名のラベル(例:「ガートレー」、「ダブルトップ」)が表示されます。
- 緑のラベル:強気パターンを示し(買いを探す)。 📈
- 赤のラベル:弱気パターンを示し(売りを探す)。 📉
解釈:
- すべてのラベルを盲目的に取引しないでください。警告信号として使用してください。
- パターンが現れたら、Dゾーンでの価格の反応を待ちます(パターンの最後のポイント)。
- エントリー前に、追加の確認(日本の反転ローソク足やRSIのダイバージェンスなど)を探します。
主な調整項目:
- 特定のパターンだけを取引したい場合は、特定のパターンを有効または無効にできます(例:「バット」と「ガートレー」のみ)。 ✅
- ジグザグの感度を調整して、より速い動きや遅いトレンドを表示できます。 ⚙️
🏆 10,000人以上のトレーダーが当社の25以上のアルゴリズムスイートを信頼しています! 🏆
市場構造と流動性からスマートエグジットシステムと予測ツールまで、必要なすべてのツールを構築しました。
👉 すべての25以上の実証済みシステムにアクセス:
_______________________________________________
📌 市場構造インジケーター
· ✅ AdvancedMarket Structure: Bos, Choch, SwinLevels, Order Blocks, Market Structure& Liquidity Finder
· 🔄 Dynamic Market StructureAnalysis of Turning Points
· 🧱 Order Block
· ⚖️ Market Imbalance
· ⛓️ BOS & CHOCH
· 🧠 ICT Power of 3
_______________________________________________
🔚 スマートエグジットシステム
_______________________________________________
📐 ジグザグインジケーター
· 🔍 ZigZag Price LiquidityProjection
· ➖ ZigZag
_______________________________________________
🧱 サポート&レジスタンスインジケーター
· 🟩 SmartTrend Support &Resistance Lines
· 🧱 All Support and ResistanceLevels
_______________________________________________
📊 トレンド&チャネルインジケーター
· 📊 Supertrend
_______________________________________________
💧 ボリューム&流動性ツール
_______________________________________________
⚡ モメンタム&RSIインジケーター
· 🔎 Multi-Level Candle Bias
Tracker
_______________________________________________
🔮 予測&プロジェクションツール
· 📈 ボリューム駆動型マーケットフロープロジェクター_________________________
_________________________________________________________________________________________________
_________________________________________________________________________________________________
RSIチャネルトリガー: 📶
これは何か: RSI(期間)を計算し、RSIが買われ過ぎ/売られ過ぎの閾値(デフォルト70/30)を越えたときにモメンタムゾーンを視覚的にマークするインジケーターです。✅
https://chartshots.spotware.com/c/69278f8b6d973
ロジック: 閾値を越えると、クロスオーバー時のローソク足の高値/安値に基づいて「ゾーン」を作成します。次に:🧠
- そのゾーン内のローソク足に色を付けます。
- チャネル(高値、安値、中間)を描きます。
- RSIパネル上に円とラベルでクロスオーバーをマークします。
ゾーンは正確にMinZoneDuration バー続きます。⏱️
明確なシグナル:
- 買われ過ぎを上抜けるクロスオーバー→強気ゾーンを開始します。🟢
- 売られ過ぎを下抜けるクロスオーバー→弱気ゾーンを開始します。🔴
ゾーン自体は注目エリアであり、注文ではありません。
https://chartshots.spotware.com/c/69278fb274e0b
使い方(簡単に):
- ゾーンが形成されるのを待ちます。🎯
- 価格アクション(チャネルラインからのブレイクアウト/拒否)で確認します。
- ゾーンの外にストップロスを置き、チャネルの中間線または定義されたリスク/リワード比率のターゲットでエントリーします。
https://chartshots.spotware.com/c/69278fe76237b
主なパラメーター: ⚙️
- RSI期間(14)
- 買われ過ぎ(70)
- 売られ過ぎ(30)
- MinZoneDuration(15)
- 設定可能な色 🎨
概要
The algorithm recognizes classic and complex patterns—including Double Top/Bottom, Gartley, Bat, Butterfly, Crab, Deep Crab, Shark, Cypher, ABCD structures, and exotic patterns like Three Drives and 5-0—by measuring distances and Fibonacci ratios between pivot points. Upon pattern completion, it visually displays colored geometric figures and labels indicating bullish (green) or bearish (red) signals.
Users can customize pattern detection and ZigZag sensitivity to suit their trading preferences. The indicator supports various markets such as Forex, commodities, indices, stocks, and cryptocurrencies, including symbols like EURUSD, GBPUSD, BTCUSD, XAUUSD, NAS100, and USDJPY.
XABCD Master Detector aims to reduce subjectivity and save analysis time by automatically calculating Fibonacci retracements, extensions, and theoretical risk/reward ratios. It serves as an alert tool to detect reversals, identify entry points, and provide additional confluence to existing support/resistance strategies.
カスタマーレビュー
5 | 100 % | |
4 | 0 % | |
3 | 0 % | |
2 | 0 % | |
1 | 0 % |