
Descrição
QX FrameForge é um painel de sobreposição de estado de mercado em múltiplos períodos de tempo para cTrader. Ele comprime o que está acontecendo em vários períodos de tempo em um painel rápido e legível, para que você possa negociar com contexto em vez de adivinhar.
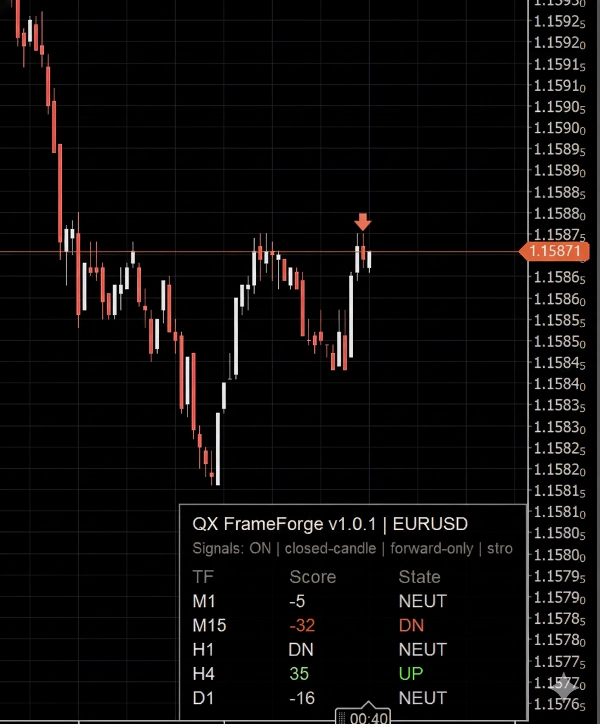
Para cada período de tempo selecionado, o painel mostra:
- TF (período de tempo)
- Score (-100 a +100) para expressar direção e força
- Estado: UP / NEUT / DN para decisões rápidas
Setas opcionais podem ser ativadas para marcar confirmações usando apenas velas fechadas, o que mantém o gráfico estável e evita flicker intrabar.
Como ler (amigável para iniciantes)
Pense no painel como um medidor de direção:
- Score Positivo e UP significa condições de alta nesse período de tempo
- Score Negativo e DN significa condições de baixa nesse período de tempo
- NEUT significa que as condições estão mistas, em faixa, ou não são fortes o suficiente para serem direcionais
Uma configuração de Zona Neutra controla com que facilidade o indicador muda para NEUT. Uma zona neutra mais ampla produz menos estados direcionais (mais conservador).
O que está dentro do Score (nível alto)
O Score combina:
- um componente de tendência (direção e comportamento da inclinação)
- um componente de momentum (força de continuação vs hesitação)
- um filtro de volatilidade opcional para reduzir períodos de ruído
O resultado é um score limitado projetado para alinhamento multi-período, não para “entradas mágicas”.
Como os traders normalmente usam o FrameForge
1) Alinhamento multi-período
- Prefira negociações quando períodos maiores concordam (exemplo: H1 + H4 ambos UP)
- Use um período menor (exemplo: M5) para temporização
2) Filtragem de regime
- Muitos estados NEUT geralmente significam mercado lateral e condições de menor qualidade
- Direção mista em períodos maiores sugere cautela ou exposição menor
3) Camada de confirmação
- Use o FrameForge para confirmar que sua configuração está alinhada antes de se comprometer
Setas opcionais (sinais)
As setas são um auxílio visual opcional. Elas são avaliadas apenas na última vela fechada.
Você pode escolher como as setas são acionadas:
- apenas quando a força cruza um limite,
- apenas quando o estado direcional muda,
- ou com mais frequência quando as condições permanecem fortes.
Os controles incluem:
- limite de força
- tempo de espera (mínimo de barras entre setas)
- um sinal por oscilação (reduz setas repetidas na mesma direção)
- limite de ícones (evita poluição no gráfico)
Importante: as setas são projetadas para serem apenas para frente a partir do momento em que você as ativa, para evitar spam de objetos históricos e visuais retroativos enganosos.
Compatibilidade
- Funciona em qualquer símbolo do cTrader e em qualquer período de tempo do gráfico
- Apenas indicador. Nenhum pedido é colocado.
- Atualizações de UI otimizadas para manter os gráficos responsivos.
Aviso de risco
Negociar envolve riscos. Desempenho passado não garante resultados futuros.
Resumo
The Score integrates trend direction and slope, momentum strength, and an optional volatility filter to reduce noise, producing a bounded metric aimed at multi-timeframe alignment rather than precise entry signals. Traders typically use FrameForge for aligning trades across timeframes (e.g., confirming higher timeframe trends before timing entries on lower timeframes), filtering market regimes by identifying choppy or mixed conditions, and adding a confirmation layer to their setups.
Arrow signals can be customized by strength thresholds, directional changes, cooldown periods, and icon limits to avoid chart clutter. The indicator works on any cTrader symbol and timeframe, updating efficiently to maintain chart responsiveness. It does not place orders and serves solely as a visual analytical tool.
Avaliações de clientes
5 | 100 % | |
4 | 0 % | |
3 | 0 % | |
2 | 0 % | |
1 | 0 % |


