

IPDA Data Range Dashboard
インジケーター
バージョン 1.0、Aug 2026
Windows、Mac
5.0
レビュー: 1

登録日 07/05/2026
5
販売
63
無料インストール
説明
IPDAデータ範囲はICTのメンタリングにおける最も基本的な概念の一つであり、この指標のほぼすべてのバージョンには同じ欠陥があります:現在表示している時間軸に基づいて「日数」をカウントするため、日足チャート以外では範囲が正しくありません。
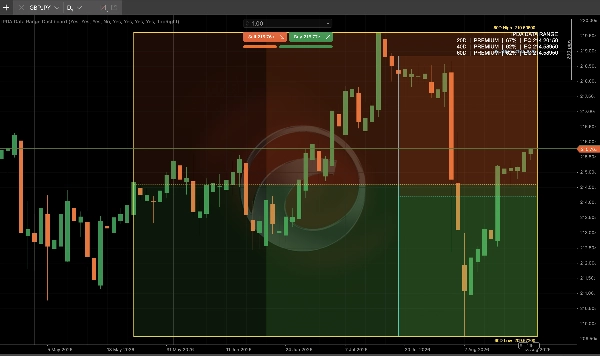
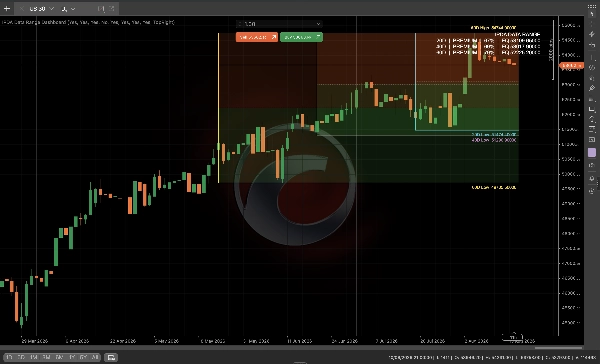
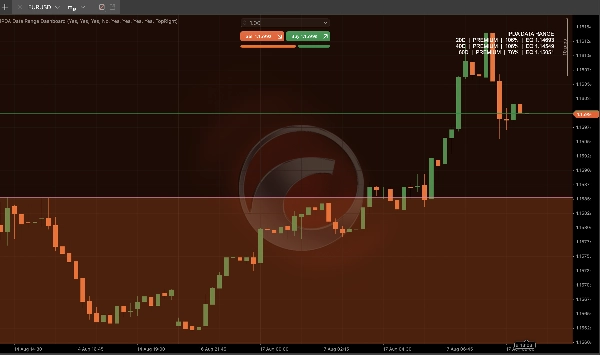
IPDAデータレンジダッシュボードはこれを修正します。すべての範囲を裏で真の日足ローソク足に固定するため、4時間足、15分足、または日足自体で取引していても、20/40/60日の機関投資家の振り返りゾーンが正確に表示されます。
あなたが得られるもの:
- 20/40/60日のIPDA範囲、それぞれ独立して切り替え可能
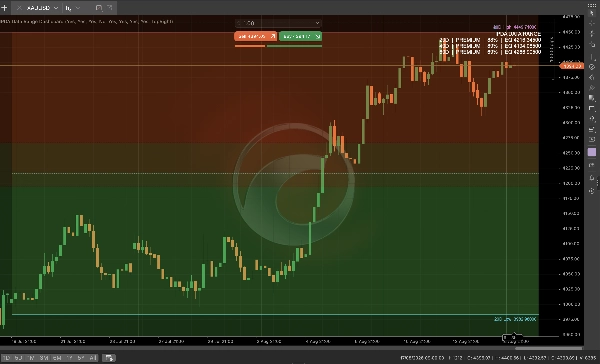
- 各範囲に対するライブの均衡線付きプレミアム/ディスカウントのシェーディング
- 四半期シフトマーカー — 価格が前の60日間の極値を超えてクローズしたときのフラグ、これは機関投資家の範囲拡大の真のシグナルです
- 各範囲のゾーン、ポジション%、均衡価格を一目で示すライブダッシュボードパネル
- どのチャート時間軸でも完全に正確 — 既存のすべてのバージョンにおける核心的なギャップ
高時間軸バイアスモデルを使用するトレーダー向けに作られています 日足チャートに切り替えることなくプレミアム/ディスカウントのコンテキストが必要な方に。1度取り付ければ、好きな時間軸で取引できます。
概要
AI summary
The IPDA Data Range Dashboard is a trading indicator designed to provide accurate institutional price range analysis anchored to true daily candles. It calculates 20-, 40-, and 60-day IPDA lookback ranges independently of the chart timeframe, ensuring precision whether used on 15-minute, 4-hour, or daily charts. Key features include toggleable IPDA ranges, premium and discount zones with live equilibrium lines, and quarterly shift alerts that flag when price closes beyond prior 60-day extremes, indicating institutional range expansions. The dashboard panel displays each range’s zone, position percentage, and equilibrium price for quick reference. This tool addresses common inaccuracies in other IPDA indicators by maintaining consistent daily anchoring, making it suitable for traders employing higher-timeframe bias models who require premium/discount context without switching chart timeframes. The indicator supports visualization outputs and requires bar data for operation. It integrates concepts related to market structure such as breaker blocks, fair value gaps, breaks of structure, and support/resistance zones.
インジケーターのプロフィール
インジケーターのカテゴリー
市場構造(SMC)
出力の種類
ビジュアル表示
シグナル
データ要件
バーのみ
カスタマーレビュー
5.0
レビュー: 1
5 | 100 % | |
4 | 0 % | |
3 | 0 % | |
2 | 0 % | |
1 | 0 % |
カスタマーレビュー
August 19, 2026
A focused and well-executed IPDA analysis tool. The 20/40/60-day ranges, Premium/Discount zones, equilibrium levels and dashboard worked consistently during testing. Most importantly, the same Daily-derived equilibrium values were maintained across M2, H1 and D1 charts, supporting the product's core multi-timeframe claim. The interface can become visually dense with all ranges enabled, but individual toggles make this manageable. Overall, a useful and stable higher-timeframe context tool.
ディスカッション
よくあるご質問
Breaker Block
Premium/Discount
Fair Value Gap
AI-assisted
BOS
Volume
Support & Resistance
cTrader Storeで入手可能な取引ボット、インジケーター、プラグインなどの商品は、第三者の開発者が提供するものであり、情報と技術の取得のみを目的としてご利用いただけます。cTrader Storeはブローカーではなく、投資助言や個人的な推奨を行うことも、将来のパフォーマンスを保証することもありません。
この作成者の他の商品






























価格
登録日 07/05/2026
5
販売
63
無料インストール