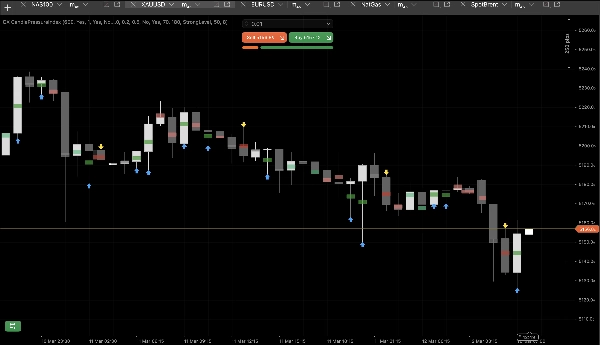
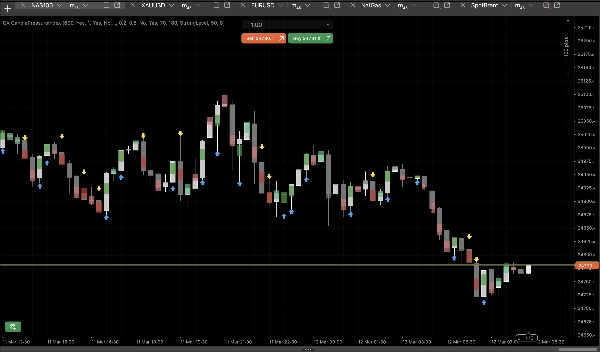
"QX CandlePressureIndex" logosu
QX CandlePressureIndex
"QX CandlePressureIndex" yüklenen resmi
35.59M
İşlem hacmi
196.32K
Kazanılan pip
9
Satışlar
228
Ücretsiz yüklemeler
Deneme sürümü hakkında
This trial version uses the same core CPI calculation and visual logic as the paid version, so traders can evaluate the indicator properly in real market conditions. The trial is limited in the following ways: • Displays only the most recent 120 bars • Uses a fixed color palette • Arrow Mode is fixed to Strong Level • Neutral markers remain visible at all times • Bar Width is fixed • Marker Scale is fixed • Body Opacity is fixed • Marker Opacity is fixed • Advanced customization options are reserved for the paid version

QX Candle Pressure Index is a candle pressure overlay for cTrader that helps traders read how strongly each candle closes within its own range.

Instead of using a separate oscillator window, CPI displays pressure directly on the main chart through compact midpoint markers. This makes it easier to read close strength, bullish or bearish bias, and short-term momentumwith less visual noise.


Main Uses

CPI is designed to help traders:

  • evaluate candle close quality
  • confirm directional pressure
  • assess breakout strength
  • read pullbacks more clearly
  • spot momentum shifts earlier


How It Works

Each candle is classified by where it closes inside its own range:

  • near the high = bullish pressure
  • near the low = bearish pressure
  • near the middle = neutral pressure


This information is displayed using:

  • midpoint pressure markers
  • 5 pressure zones
  • optional arrows for strong pressure
  • optional body overlay


Pressure Zones

CPI separates candles into 5 visual states:

  • Strong Buy
  • Mild Buy
  • Neutral
  • Mild Sell
  • Strong Sell

This helps traders identify whether a move is strong, weak, or balanced.


Main Features


Midpoint Pressure Markers

Compact visual markers anchored at the candle midpoint.


5 Pressure Zones

Clear separation between strong, mild, and neutral closes.


Skip Forming Bar

Ignores the live candle until it closes for more stable readings.


Hide Neutral Markers

Keeps the chart cleaner by showing only directional candles.


Arrow Modes

Highlights strong bullish or bearish candles visually.


Body Overlay

Adds a subtle extra layer for easier chart reading.


Main Parameters and How to Use Them


Draw Bars Back

Controls how many past candles are shown.


Skip Forming Bar

Turn on for closed-bar reading and more stable signals.


Mild Threshold

Defines when a candle stops being neutral.


Strong Threshold

Defines when pressure becomes strong.


Hide Neutral Markers

Use for a cleaner directional view.


Arrow Mode

Choose between no arrows, arrows on every strong candle, or arrows only on strong transitions.


Marker Scale / Width / Opacity

Adjust the visual appearance to fit your chart style.


Best Used For

  • trend continuation confirmation
  • breakout quality assessment
  • pullback analysis
  • short-term momentum reading
  • cleaner price-action interpretation


Summary

QX Candle Pressure Index is a clean visual tool for traders who want to read candle pressure directly on the chart, without adding another indicator pane.

Deneme sürümü hakkında
This trial version uses the same core CPI calculation and visual logic as the paid version, so traders can evaluate the indicator properly in real market conditions. The trial is limited in the following ways: • Displays only the most recent 120 bars • Uses a fixed color palette • Arrow Mode is fixed to Strong Level • Neutral markers remain visible at all times • Bar Width is fixed • Marker Scale is fixed • Body Opacity is fixed • Marker Opacity is fixed • Advanced customization options are reserved for the paid version
Indicator profile
0.0
Değerlendirmeler: 0
Müşteri değerlendirmeleri
Bu ürün için henüz bir değerlendirme yok. Ürünü denediniz mi? O zaman ona dair görüşlerini paylaşan ilk kişi olun!
BTCUSD
Forex
Signal
Breakout
Indices
EURUSD
Commodities
GBPUSD
NZDUSD
Prop
Scalping
SMC
Crypto
Grid
Stocks
XAUUSD
NAS100
USDJPY
Products available through cTrader Store, including trading bots, indicators and plugins, are provided by third-party developers and made available for informational and technical access purposes only. cTrader Store is not a broker and does not provide investment advice, personal recommendations or any guarantee of future performance.

Bu oluşturanın diğer ürünleri

Free educational Renko cBot made to help traders learn how Renko automation works and to showcase my development style.
Multi-timeframe heatmap scoring Direction, Strength & Volatility at a glance!
QX SessionBox ORB: Session boxes + ORB levels + clean dashboard with optional closed-candle breakout signals.
Multi-timeframe market-state dashboard: Score (-100..+100) + UP/NEUT/DN per TF, with optional closed-candle arrows.
SMC without the mess: Clean structure + auto-managing FVGs + MTF panel. Hard-right-edge, step size-based for any symbol.
Real-time multi-asset correlation matrix with 5 themes, Δ% performance tracking, and full customization. Up to 12 symbol
Liquidity sweeps without clutter. Equal highs/lows pools, sweeps + reclaim, filters + compact panel. StepSize-based.
Session Volume Profile + Composite. POC/VAH/VAL, Focus/Solo. Fast, clean, no ghosts, live-ready.
Risk-first position sizing panel for indices and FX majors. Clean. Non-repainting. Built for real trading.
Learn candlestick patterns with live signals, objective rules, context notes, and an interactive quiz training mode.
Pivot Points (Classic/Fibo/Camarilla/Woodie) with price zones, multi-timeframe confluence (D/W/M) and smart alerts.

Şunları da beğenebilirsiniz

Amplitude Momentum Optimizer — FREE TRIAL Version to Find Out If the Complete Indicator Has a Real Edge.
One of the best indicators we have ever developed, with a very high profit ratio.
QQE osc. Smoothed RSI with ATR-based smoothing that generates crossover and level-based signals, supports MTF
Universal multi time frame 'Moving Average' indicator with extended features
Enhance trading with ATR Bands! Visualize market volatility using dynamic upper and lower ATR bands for precise decision
Buy-Side & Sell-Side Liquidity (BSL/SSL) Indicator
Daily/Weekly/Monthly - Highs & Lows Indicator (Customizable Settings)
Detects Head & Shoulders patterns, plots signals, and alerts for trading opportunities.
Provides comprehensive trend and momentum analysis by combining EMAs, RoC, normalized ATR, RSI, and volume..
Swing-Trading Indicaotr for pairs like EUR/USD, AUD/USD, and USD/JPY. Most effective on higher time frames H4,H6,H12...
Smart Money Concepts (SMC)
A straightforward yet effective tool signals entry points for both buying and selling. Include 3 Moving Average
Lusinvest - Sessions Control is a visual indicator designed for traders who want to clearly monitor the price
The ZigZag Indicator is a market structure tool that filters out small price fluctuations and highlights major swing.
This Fair Value Gap (FVG) indicator is a technical analysis on multi-timeframe.
Price Magnet finds hidden institutional zones by price density. High-precision support and resistance levels.
show spread on chart
SMA Cross Signal – Simple Moving Average Crossover with Visual Alerts (FREE)
35.59M
İşlem hacmi
196.32K
Kazanılan pip
9
Satışlar
228
Ücretsiz yüklemeler