
QX Heatmap Scanner
インジケーター
5 購入済
バージョン 1.0、Dec 2025
Windows、Mac
4.3
レビュー: 3
説明
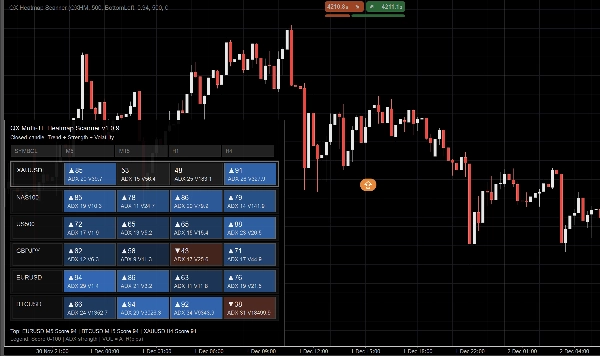
QX Heatmap Scanner は、複数のシンボルと時間枠を数秒でスキャンできるコンパクトなチャート上のヒートマップパネルです。市場の 方向性、強さ、および ボラティリティ を明確なセルごとのスコアにまとめ、最適な条件を優先し、低品質なセットアップを回避できます。
表示内容
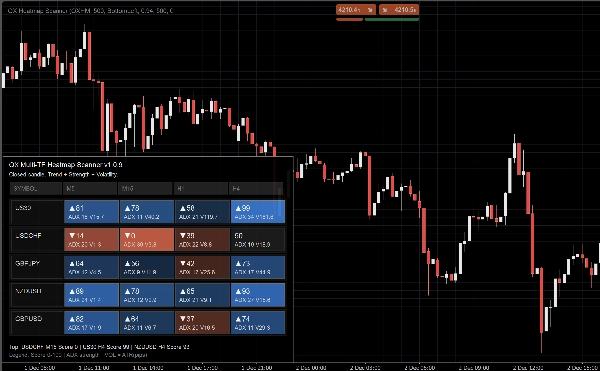
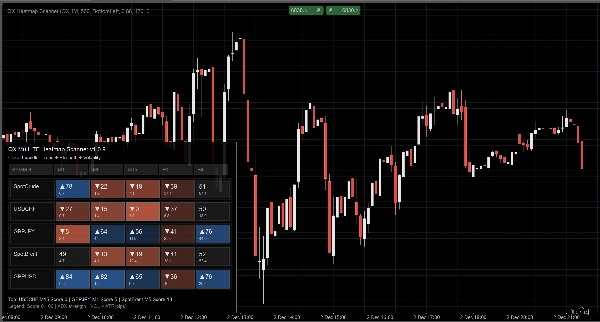
各セル(シンボル × 時間枠)には以下が表示されます:
- スコア(0~100) と方向マーカー(バイアスがある場合は▲/▼)
- ADX 値(強さの文脈)
- VOL 値(ボラティリティの文脈)
色の濃さは確信度を反映します。多くの時間枠があってもレイアウトは読みやすさを保ちます。
表示モード
- 自動:利用可能なセル幅に適応
- フル:最大の詳細表示
- コンパクト:ADXとVOLを表示しつつ、より多くの時間枠に最適化
- ミニマル:小さい画面向けの超タイトなレイアウト
役立つ理由
- エントリー前のトップダウンコンテキストを迅速に把握
- 多くのチャートを開かずに市場間の比較が簡単
- 強い条件を強調して意思決定を明確に
パフォーマンスと安定性
- よりクリーンなシグナルとノイズ低減のために 確定足 で更新するよう設計
- 更新スロットル(ms) でCPU使用率を制御
- シンボル欠損やデータ不足に対する防御的処理
主な特徴
- マルチシンボル、マルチ時間枠のヒートマップパネル
- セルごとに0~100のスコアと明確な方向指示
- 一貫して表示されるADXとVOL
- 調整可能なパネルの角、幅、不透明度、フォント
- 色のカスタマイズ(強気/弱気/中立+強度範囲)
主要パラメータ
シンボル(CSV)、時間枠(CSV)、表示密度、パネル幅/角/不透明度、VOL表示、フォントサイズ、更新スロットル。
注意: このツールは市場のコンテキストを提供します。自動取引システムではなく、リスク管理の代わりにはなりません。
概要
AIによる概要
QX Heatmap Scanner is an on-chart indicator panel designed for multi-symbol and multi-timeframe market analysis. It provides a heatmap view that scores each symbol and timeframe combination from 0 to 100, reflecting market direction, strength, and volatility. Each cell displays a directional marker (up or down), ADX value for trend strength, and volatility (VOL) value, with color intensity indicating conviction level.
The panel supports various display modes—Auto, Full, Compact, and Minimal—allowing customization for different screen sizes and detail preferences. Users can adjust panel position, width, opacity, fonts, and color schemes for bullish, bearish, and neutral conditions.
QX Heatmap Scanner updates on closed candles to reduce noise and includes an update throttle feature to manage CPU usage. It handles missing symbols or insufficient data defensively to maintain stability.
Key features include quick top-down market context, cross-market comparison without multiple charts, and highlighting of stronger trading conditions. It supports symbols such as BTCUSD, EURUSD, GBPUSD, and markets including Forex, Crypto, Stocks, Commodities, and Indices. Parameters like symbols, timeframes, display density, and update throttle are user-configurable.
This tool provides market context to assist decision-making but does not execute trades or replace risk management.
インジケーターのプロフィール
カスタマーレビュー
4.3
レビュー: 3
5 | 33 % | |
4 | 67 % | |
3 | 0 % | |
2 | 0 % | |
1 | 0 % |
カスタマーレビュー
December 6, 2025
Patient market filter for traders who monitor several markets or signals. It gives value around market monitoring, but too much information can distract without a process. It saves time if daily review drops from 15 minutes to under 10. The value is speed and clarity, not a trade signal by itself.
December 5, 2025
December 5, 2025
Clear setup tool for market monitoring. it keeps useful information closer to the trader, especially when used for reviewing conditions without jumping between views. The dashboard style makes 10 minute reviews easier, especially when checking 5 to 8 markets. The value is speed and clarity, not a trade signal by itself.
ディスカッション
よくあるご質問
BTCUSD
Forex
Signal
Breakout
Indices
EURUSD
Commodities
GBPUSD
NZDUSD
RSI
Bollinger
Fibonacci
Scalping
Fair Value Gap
Crypto
Stocks
XAUUSD
NAS100
ATR
USDJPY
VWAP
cTrader Storeで入手可能な取引ボット、インジケーター、プラグインなどの商品は、第三者の開発者が提供するものであり、情報と技術の取得のみを目的としてご利用いただけます。cTrader Storeはブローカーではなく、投資助言や個人的な推奨を行うことも、将来のパフォーマンスを保証することもありません。


価格
41.97M
取引数量
208.53K
獲得pips
14
販売
363
無料インストール