
QX MatrixHybrid
インジケーター
バージョン 1.0、Feb 2026
Windows、Mac
4.6
レビュー: 3
説明
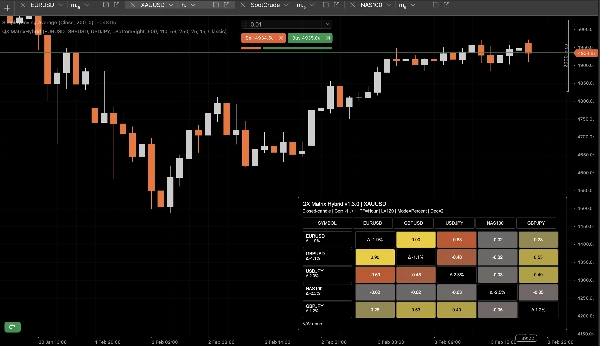
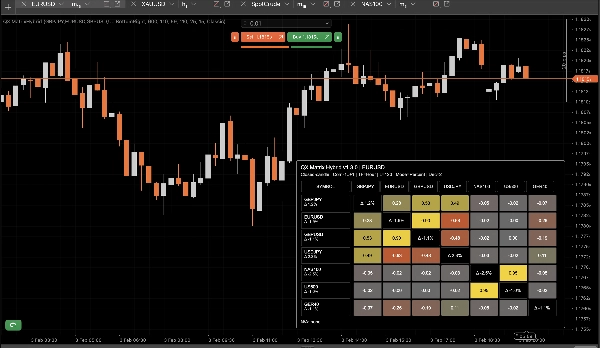
QX Matrix Hybrid は、マルチアセット相関マトリックス をクリーンなヒートマップパネルとして表示する視覚的インジケーターです。これにより、どの銘柄が一緒に動くか、逆に動くか、そして市場間で意図せずにエクスポージャーを重複させている可能性がある箇所を瞬時に特定できます。
主な特徴
- 相関マトリックス(-1から+1) ピアソン相関 をシンボル間で使用。
- リターンモード:
-
- パーセントリターン
- 対数リターン
- シンボルごとの強さ(Δ%): 各シンボルのルックバック期間中のパフォーマンスを(行ラベルおよびオプションで対角線上に)表示。
- 自動テキストコントラスト: 背景の輝度に応じてテキスト色が調整され、読みやすさを確保。
- テーマ+カスタムパレット: 複数のプリセットと完全なカラーピッカーコントロール。
- 柔軟なパネルレイアウト: コーナードッキング、幅、セルサイズ、マージン、行の高さ制御。
- スマートフッター: 欠落または利用不可のシンボルをリストアップし、切り捨て設定可能。
パフォーマンスと更新ロジック
複数のシンボルでも応答性を維持するよう設計:
- シンボルごとのキャッシュ SymbolおよびBarsオブジェクトの繰り返しAPI呼び出しを回避。
- 自動キャッシュ無効化 Symbols CSV または TimeFrame が変更されたとき。
- クローズドキャンドルのみ モードでCPU負荷を最小化(新しいクローズドバーで更新)。
- オプションの 更新スロットル(ms) ライブモード用。
使い方
- +1.00: 強い正の共動(高い冗長性)。
- 0.00: 関係が低い(潜在的な分散効果)。
- -1.00: 強い逆相関(ヘッジの可能性)。
このマトリックスを使って相関の重複を減らし、ヘッジペアを見つけ、FX、指数、金属、暗号通貨などの市場の「クラスター」を理解しましょう。
パラメータ(概要)
- Symbols CSV, TimeFrame, Lookback
- リターンモード(パーセント/対数), 小数点以下の桁数, 対数での自動小数点
- クローズドキャンドルのみ, 更新スロットル
- 強さ表示(Δ%), フッター表示, フッター最大欠損数
- パネルレイアウト (コーナー、幅、セルサイズ、マージン)
- カラー / テーマ (カスタムパレット含む)
注意事項
- 可視化のみ。注文は行われません。
- シンボルは、ブローカー/サーバーで利用できない場合や選択されたタイムフレーム/ルックバックの履歴が不十分な場合、N/Aと表示されることがあります。
概要
AIによる概要
QX MatrixHybrid is a real-time visual indicator that presents a multi-asset correlation matrix as a heatmap panel. It displays Pearson correlation coefficients ranging from -1 to +1 between up to 12 selected symbols, helping users identify strong positive correlations, inverse relationships, and low correlations for diversification or hedging purposes. The indicator supports multiple return modes, including percent and log returns, and tracks each symbol’s performance over a configurable lookback period, showing strength as percentage change.
The interface offers full customization with multiple color themes and a custom palette, adjustable panel layout options (such as docking, cell size, and margins), and automatic text contrast for readability. It includes a smart footer that lists missing or unavailable symbols with configurable truncation.
Performance optimizations include per-symbol caching to reduce API calls, automatic cache invalidation on symbol or timeframe changes, and a "Closed Candle Only" mode to minimize CPU load by updating only on new closed bars. An optional update throttle controls live update frequency.
QX MatrixHybrid is designed for use across various markets including forex, indices, commodities, metals, and cryptocurrencies. It is a visualization tool only and does not place orders. Symbols may show as unavailable if data is insufficient or missing.
インジケーターのプロフィール
カスタマーレビュー
4.6
レビュー: 3
5 | 67 % | |
4 | 33 % | |
3 | 0 % | |
2 | 0 % | |
1 | 0 % |
カスタマーレビュー
February 12, 2026
The part that matters is bad ideas get easier to avoid, and 20 signals is a fair first sample.
February 9, 2026
Two sessions say more than one clean chart, and weak ideas are easier to skip.
February 5, 2026
Ngl, weak ideas are easier to skip and that is enough to keep testing it. Price action still has to agree.
ディスカッション
よくあるご質問
Signal
Indices
Commodities
GBPUSD
RSI
Bollinger
Fibonacci
Scalping
AI
XAUUSD
NAS100
MACD
BTCUSD
Forex
Breakout
EURUSD
NZDUSD
Martingale
Prop
ZigZag
Supertrend
Fair Value Gap
SMC
Crypto
Grid
Stocks
ATR
USDJPY
VWAP
cTrader Storeで入手可能な取引ボット、インジケーター、プラグインなどの商品は、第三者の開発者が提供するものであり、情報と技術の取得のみを目的としてご利用いただけます。cTrader Storeはブローカーではなく、投資助言や個人的な推奨を行うことも、将来のパフォーマンスを保証することもありません。


![「High-Low Divergence [Iridio Capital]」ロゴ](https://cdn.ctrader.com/image/webp/443c4661-7abb-40f1-842f-4b6ec560649b_40914)


価格
41.97M
取引数量
208.53K
獲得pips
13
販売
353
無料インストール