
説明
Higher timeframeのキャンドルトラッカーは、選択した上位時間枠のキャンドルの様子を把握するために使用されます。
主な特徴:
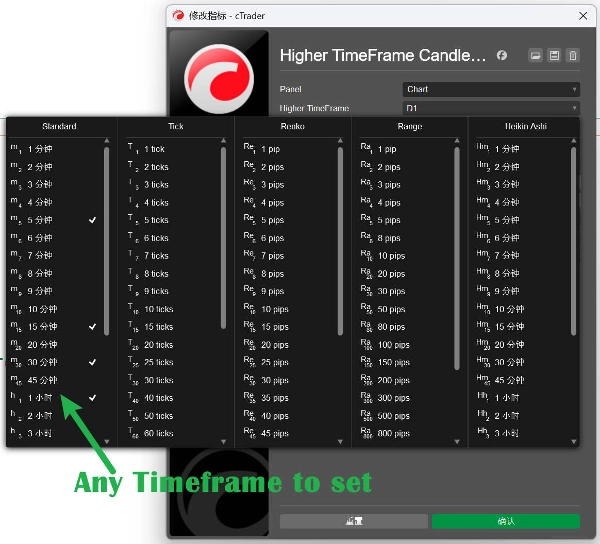
- カスタマイズ可能な時間枠選択 - 任意の上位時間枠を選択(Daily、Weekly、Monthlyなど)
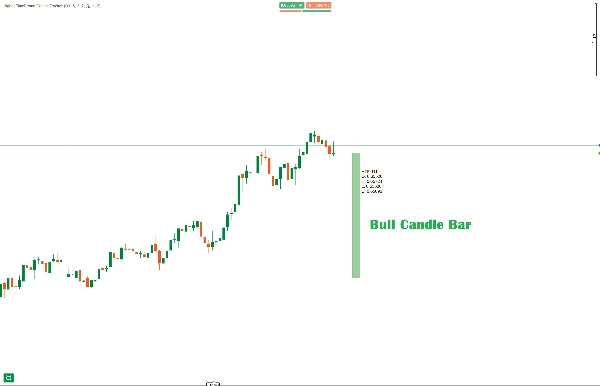
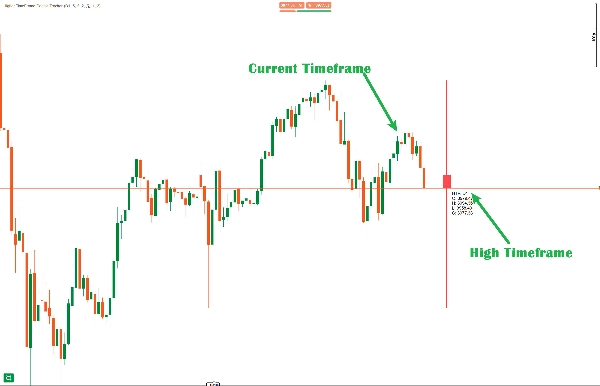
- 視覚的なキャンドル表示 - 現在のHTFキャンドルが適切なヒゲと実体で、現在の価格アクションからオフセットしてプロットされます
調整可能な設定:
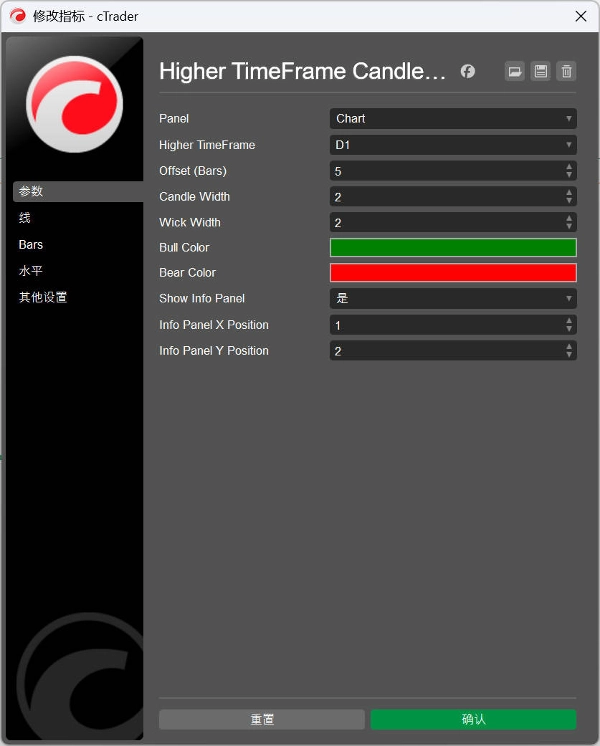
- オフセット: 現在の価格からのバー数の距離(デフォルト:5)
- キャンドル幅: キャンドル実体の太さ(1-10、デフォルト:3)
- ヒゲ幅: ヒゲ線の太さ(1-5、デフォルト:1)
- 色: カスタマイズ可能なブル(緑)とベア(赤)の色
対応時間枠:
- Minute, Minute2, Minute3, Minute4, Minute5
- Minute10, Minute15, Minute30, Minute45
- Hour, Hour4, Hour12
- Daily, Day2, Day3
- Weekly, Monthly
情報テーブル - リアルタイムのHTFキャンドルデータを表示:始値、高値、安値、終値の値。
中文说明:
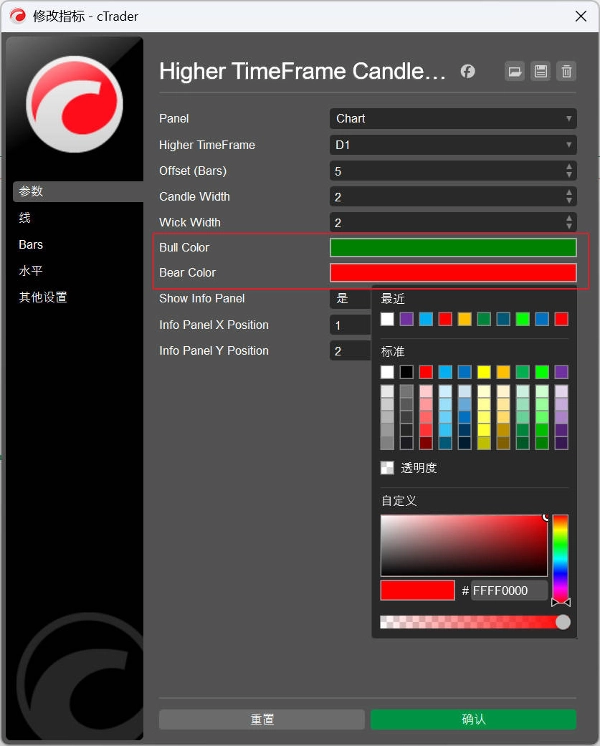
可自定义参数:
- Higher TimeFrame(高时间框架) - 选择要跟踪的时间框架(默认:Daily)
- Offset(偏移量) - K线距离当前价格的位置(默认:5根K线)
- Candle Width(K线宽度) - K线实体的宽度(1-10,默认:3)
- Wick Width(影线宽度) - 影线的宽度(1-5,默认:2)
- Bull Color(看涨颜色) - 看涨K线颜色(默认:Green)
- Bear Color(看跌颜色) - 看跌K线颜色(默认:Red)
- Show Info Panel(显示信息面板) - 是否显示HTF数据面板(默认:true)
コア機能:
- リアルタイムHTFキャンドル表示 - チャート上に現在の上位時間枠キャンドルを描画
- 完全なキャンドル構造 - 実体、上ヒゲ、下ヒゲを含む
- 色の区別 - 上昇と下降に応じて自動的に異なる色を使用
- 情報パネル - Open、High、Low、Closeおよび方向指示を表示
- 適応的な塗りつぶし - ブルキャンドルは半透明、ベアキャンドルは濃い色
対応時間枠:
- Minute, Minute2, Minute3, Minute4, Minute5
- Minute10, Minute15, Minute30, Minute45
- Hour, Hour4, Hour12
- Daily, Day2, Day3
- Weekly, Monthly
概要
インジケーターのプロフィール
カスタマーレビュー
0.0
レビュー: 0
カスタマーレビュー
この商品にはまだレビューがありません。お使いになったことがある方は、ぜひレビューをお願いします。
ディスカッション
よくあるご質問
Prop
Forex
Breakout
Indices
Commodities
Crypto
Stocks
cTrader Storeで入手可能な取引ボット、インジケーター、プラグインなどの商品は、第三者の開発者が提供するものであり、情報と技術の取得のみを目的としてご利用いただけます。cTrader Storeはブローカーではなく、投資助言や個人的な推奨を行うことも、将来のパフォーマンスを保証することもありません。


![「[Hamster-Coder] Bollinger Bands」ロゴ](https://cdn.ctrader.com/image/webp/21d8e5d6-fb11-4bac-b9ee-cd05c2b76804_30327)

価格
登録日 30/09/2024
44
販売