
LT_FairValueGap
Indicador
1 compras
Versión 1.0, Jun 2025
Windows, Mac
5.0
Valoraciones: 1
Descripción
Nota: Probado solo en cTrader Windows.
LT_FairValueGap es un indicador ligero y potente de Fair Value Gap diseñado para traders de acción de precio con precisión. Resalta zonas de desequilibrio al estilo institucional usando una lógica estricta de 3 barras y las elimina una vez que el precio vuelve a visitar el gap, ofreciéndote zonas limpias y accionables para entradas, salidas o confluencias.
🔍 Cómo Funciona
- Un Fair Value Gap (FVG) se identifica cuando una vela central fuerte (con cuerpo grande) crea un desequilibrio entre dos velas adyacentes.
- El gap se marca como una zona temporal de soporte/resistencia (SR).
- Una vez que el precio regresa y llena el gap, la zona deja de extenderse, asegurando que los gráficos permanezcan despejados y relevantes.
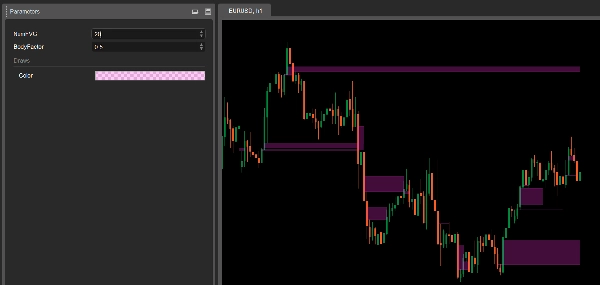
⚙️ Parámetros
- NumFVG: Número máximo de zonas FVG para mostrar en el gráfico.
- BodyFactor: Umbral de fuerza para la barra central (por defecto:
2.0×cuerpo promedio de las últimas 20 barras).
✅ Características Clave
- Detección de gaps al estilo institucional (lógica de 3 barras)
- Gráficos limpios — las zonas dejan de extenderse una vez alcanzadas
- Sensibilidad ajustable mediante BodyFactor
- Plug-and-play: configuración mínima
📌 Casos de Uso
- Identificar desequilibrios institucionales y zonas de reacción
- Usar como confluencia de entrada o marcador de invalidación
- Combinar con estructura de swing o herramientas de volumen
Ya sea que estés operando rupturas, mitigaciones o reversiones, LT_FairValueGap te ayuda a detectar las verdaderas zonas de desequilibrio que importan, sin el ruido.
Resumen
Perfil del indicador
Valoraciones de clientes
5.0
Valoraciones: 1
5 | 100 % | |
4 | 0 % | |
3 | 0 % | |
2 | 0 % | |
1 | 0 % |
Valoraciones de clientes
June 25, 2025
Ngl, market notes are quicker to compare and that is enough to keep testing it. It should not replace the chart.
Conversación
Preguntas frecuentes
Forex
Los productos disponibles a través de cTrader Store, incluidos bots, indicadores y plugins para operar, son proporcionados por desarrolladores de terceros y están disponibles únicamente con fines informativos y de acceso técnico. cTrader Store no es un bróker, por lo que no proporciona asesoramiento de inversión, recomendaciones personales ni ninguna garantía de rentabilidad futura.


Precio
Desde 25/09/2024
34
Ventas