
Descripción
QUÉ HACE
Supertrend Moving Average aborda una limitación fundamental de las medias móviles tradicionales: períodos fijos que nunca se adaptan a cómo se desarrollan realmente las tendencias.
Los períodos cortos reaccionan rápidamente pero sufren oscilaciones bruscas. Los períodos largos suavizan el ruido pero tienen un retraso considerable durante movimientos fuertes. Sin importar la configuración, se debe adivinar un número y esperar que el mercado coopere.
Este indicador elimina esa incertidumbre.
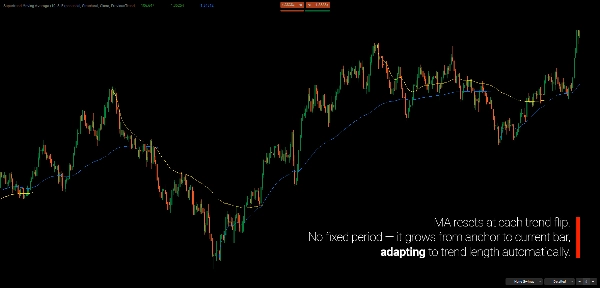
En lugar de promediar el precio sobre un número arbitrario de barras, calcula la media móvil desde el momento en que la tendencia actual comienza estructuralmente. Cuanto más dura la tendencia, más larga se vuelve la media móvil de forma natural. Las tendencias cortas permanecen sensibles. Las tendencias prolongadas se suavizan automáticamente.
El resultado es una media móvil que crece con la tendencia, no en contra de ella.
Anclada a cambios estructurales basados en Supertrend, esta media móvil se adapta al ritmo del mercado en tiempo real, sin optimización, ajuste por curva ni configuración manual. La estructura define el período, no el operador.
¿POR QUÉ STRUCTURAL SUPERTREND?
El Supertrend original cambia de dirección cuando el precio cierra más allá de su banda. Esto funciona bien en tendencias limpias pero genera una frustración común: señales falsas durante condiciones volátiles.
El problema
Una sola vela volátil que cierra ligeramente más allá de la banda provoca un cambio — incluso cuando la tendencia general permanece intacta. Los operadores que siguen el Supertrend original a menudo experimentan:
- Oscilaciones bruscas durante la consolidación
- Salidas prematuras de tendencias válidas
- Reentradas a precios peores tras falsas reversas
La solución
Structural Supertrend extiende el concepto original para reflejar mejor los cambios estructurales en lugar de la volatilidad momentánea. Filtra el ruido esperando la confirmación de un cambio direccional genuino.
El resultado son menos cambios falsos y mejor alineación con los cambios reales de tendencia.
¿Por qué mantener ambos?
El Supertrend original no es inútil — responde a una pregunta diferente.
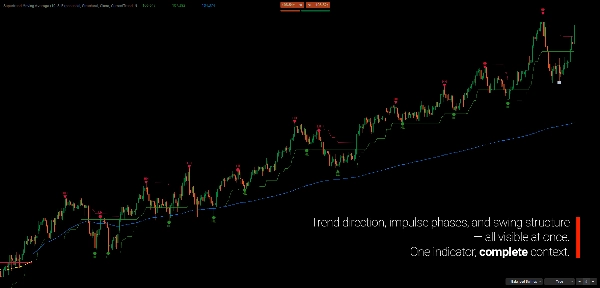
- Structural muestra la tendencia principal (la "gran imagen")
- Original muestra cambios de impulso dentro de esa tendencia (impulso vs. corrección)
Cuando ambas líneas coinciden: fuerte convicción direccional. Cuando divergen: el movimiento puede ser correctivo, no una reversión verdadera.
Esta vista de doble capa te da un contexto que ninguna línea proporciona sola.
EL CONCEPTO CENTRAL
Las medias móviles tradicionales responden: "¿Cuál es el precio promedio sobre N barras?"
Este indicador responde: "¿Cuál es el precio promedio desde que comenzó la tendencia actual?"
La media móvil se construye directamente sobre Supertrend:
- Supertrend detecta un cambio de tendencia
- El indicador encuentra el cierre extremo de la tendencia previa (máximo para nueva tendencia bajista, mínimo para nueva tendencia alcista)
- La media móvil se ancla en ese punto y calcula hacia adelante hasta la barra actual
- Cuando Supertrend cambia de nuevo, la media móvil se reinicia con un nuevo ancla
El Supertrend define la tendencia. La media móvil la mide. Funcionan como un sistema único — no como herramientas separadas.
Tú eliges qué Supertrend impulsa la media móvil:
- Structural — menos reinicios, sigue la tendencia principal
- Original — más reinicios, sigue el impulso a corto plazo
CARACTERÍSTICAS PRINCIPALES
Análisis Dual de Supertrend
- Structural Supertrend identifica la dirección de la tendencia principal usando un modelo Supertrend adaptado estructuralmente
- Original Supertrend revela el comportamiento de impulso vs. corrección dentro de la tendencia
- La comparación visual muestra cuando ambas coinciden (convicción) vs. divergen (precaución)
Media Móvil Adaptativa Basada en Ancla
- La media móvil se ancla automáticamente al cierre extremo de la tendencia previa
- El período crece dinámicamente desde el punto de anclaje — no se requieren configuraciones fijas
- Tres tipos de media móvil: Simple, Exponencial, Arnaud Legoux (ALMA)
- Codificado por colores según la dirección de la tendencia para reconocimiento instantáneo del sesgo
Contexto Multitemporal
- Aplica el cálculo de la media móvil a Supertrend de un marco temporal superior mientras ves gráficos de marcos temporales inferiores
- Ve la media móvil de tendencia diaria en tu gráfico H1 sin cambiar de marco temporal
- Detección automática de requisitos de barras con advertencias claras
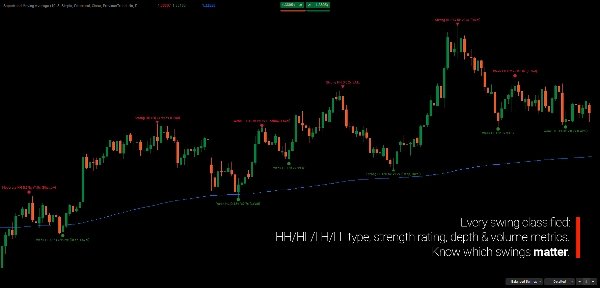
Detección Integrada de Swing
- Tres modos de detección: Menor, Equilibrado, Mayor
- Clasificación de fuerza del swing (Débil, Moderado, Fuerte)
- Etiquetas HH/HL/LH/LL confirman la estructura de la tendencia
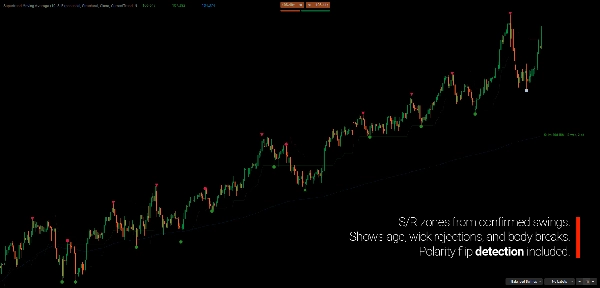
- Zonas opcionales de soporte/resistencia con seguimiento de inversión de polaridad
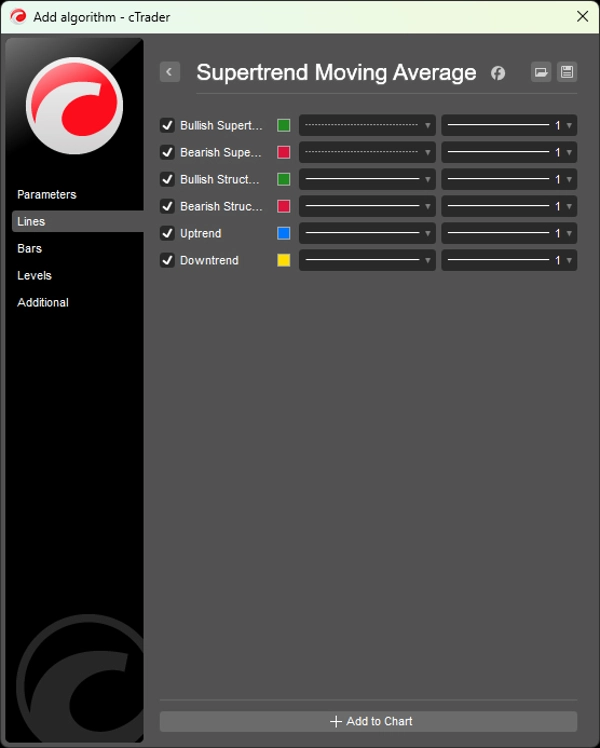
CÓMO LEER EL GRÁFICO
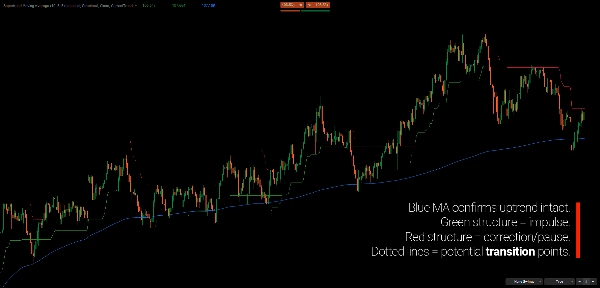
- Línea de Estructura Verde: Tendencia estructural alcista (soporte)
- Línea de Estructura Roja: Tendencia estructural bajista (resistencia)
- Línea Punteada: Supertrend Original — muestra cuando la estructura difiere del clásico
- Media Móvil Azul: Promedio de tendencia alcista desde el ancla
- Media Móvil Amarilla: Promedio de tendencia bajista desde el ancla
- Marcadores de Swing: Puntos de giro confirmados con íconos de fuerza
Chequeo de Alineación de Tendencia:
- Estructura + Original coinciden → Movimiento con alta convicción
- Estructura + Original divergen → Posible corrección o transición
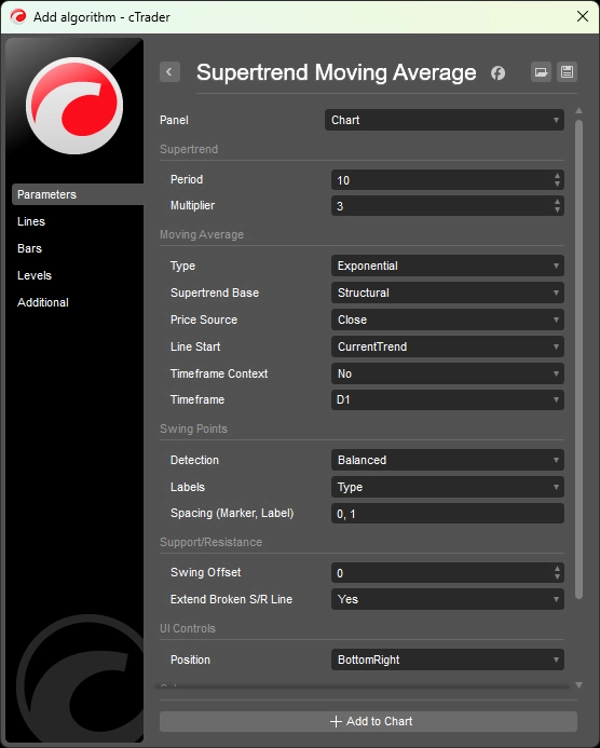
PARÁMETROS
Supertrend
- Período (predeterminado: 10)
- Multiplicador (predeterminado: 3.0)
Media Móvil
- Tipo: Ninguno, Simple, Exponencial, Media Móvil Arnaud Legoux (ALMA)
- Base Supertrend: Structural (predeterminado) u Original
- Fuente de Precio: Cierre, Apertura, Máximo, Mínimo, Mediana, Típico, Promedio
- Inicio de Línea: Tendencia Actual o Tendencia Previa
- Contexto de Marco Temporal: Activar/desactivar con selección de marco temporal
Puntos de Swing
- Modo de Detección: Ninguno, Menor, Equilibrado, Mayor
- Visualización de Etiquetas: Ninguno, Tipo (HH/LL), Detallado
- Colores y espaciado personalizables
PARA QUIÉN ES
Este indicador está diseñado para operadores que piensan en términos de estructura más que en señales.
Si te importa más entender dónde estás dentro de una tendencia que perseguir entradas perfectas, esta herramienta fue creada pensando en ti.
Es ideal para operadores de tendencia y swing que quieren una forma objetiva de seguir el desarrollo de la tendencia sin depender de medias móviles de período fijo o optimización constante de parámetros.
Analistas multitemporales se beneficiarán al ver el contexto estructural de marcos temporales superiores directamente en los gráficos de ejecución, mientras que operadores discrecionales pueden usar la media móvil anclada como referencia dinámica para retrocesos, continuaciones y agotamiento de la tendencia.
No es un generador de señales plug-and-play. Es un marco contextual para operadores que valoran claridad, consistencia y lógica estructural en su toma de decisiones.
QUÉ LO HACE DIFERENTE
Las decisiones de trading a menudo implican un compromiso familiar: rápido pero ruidoso, o suave pero tardío.
Este indicador se adapta a cómo se desarrolla realmente el mercado. Las tendencias cortas producen medias móviles sensibles. Las tendencias prolongadas evolucionan naturalmente hacia medias más suaves. No se requiere optimización — la estructura define el período.
Al comparar Structural y Original Supertrend, el indicador proporciona un contexto claro para distinguir entre la continuación de la tendencia y el movimiento correctivo dentro de la tendencia.
---
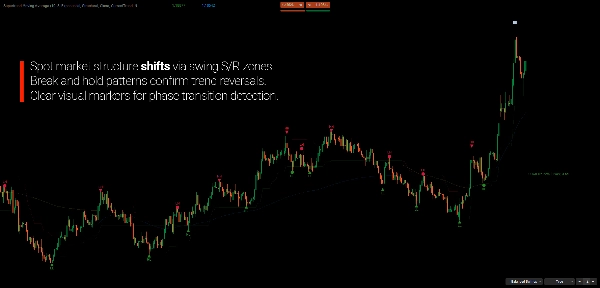
ENTENDIENDO LA ESTRUCTURA DEL MERCADO
La estructura del mercado es el estudio de cómo evoluciona el precio a través de secuencias de expansión y contracción, en lugar de velas o indicadores aislados. Las tendencias no se definen por movimientos únicos, sino por la relación entre swings — máximos más altos y mínimos más altos en tendencias alcistas, máximos más bajos y mínimos más bajos en tendencias bajistas.
Desde esta perspectiva, una tendencia no es algo para predecir, sino algo para observar y validar. Lo que importa no es si el precio sube o baja en la barra actual, sino si la estructura subyacente permanece intacta o comienza a degradarse.
Por eso el análisis basado en estructura se enfoca menos en el momento perfecto para entrar y más en el contexto: dónde se encuentra el mercado dentro de su fase actual, si los movimientos son impulsivos o correctivos, y cómo la nueva información encaja en la estructura existente.
Los indicadores construidos alrededor de la estructura del mercado no están destinados a reemplazar la toma de decisiones, sino a apoyar una interpretación más clara de lo que el precio ya está comunicando.
---
El trading implica riesgos. Este indicador es una herramienta de análisis técnico — siempre aplica una gestión de riesgos adecuada.
Resumen
The indicator integrates dual Supertrend analyses: a Structural Supertrend that identifies major trend direction by filtering out noise and confirming genuine directional changes, and the Original Supertrend that highlights momentum shifts within the trend. Comparing these two provides context for distinguishing strong trend continuation from corrective movements.
Key features include:
- Adaptive anchor-based moving averages with options for Simple, Exponential, or Arnaud Legoux (ALMA) types.
- Multi-timeframe capability to apply higher timeframe Supertrend context on lower timeframe charts.
- Integrated swing detection with configurable modes and strength classification.
- Color-coded trend lines and swing markers for clear visual interpretation.
This tool is suited for trend and swing traders, multi-timeframe analysts, and discretionary traders seeking a structural framework to track trend development and market rhythm objectively. It emphasizes market structure and context over fixed signals, supporting clearer interpretation of price behavior.
Valoraciones de clientes
5 | 100 % | |
4 | 0 % | |
3 | 0 % | |
2 | 0 % | |
1 | 0 % |


![Logotipo de "[CB] Pivot Points Pro"](https://cdn.ctrader.com/image/webp/43463c82-67b0-4f10-a4ba-901bba091d81_32594)


