
KANDIKA HEAT MAP
Indicador
1 compras
Versión 1.0, Jul 2025
Windows, Mac
4.6
Valoraciones: 3
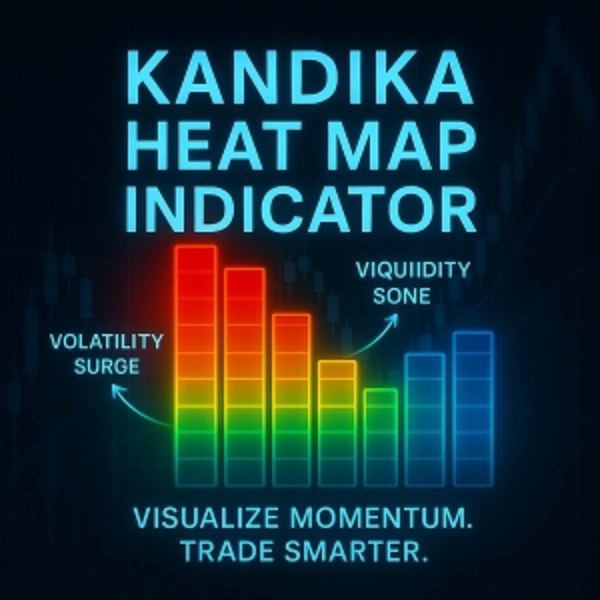
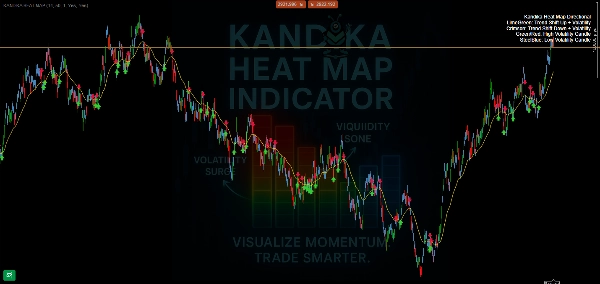
🎨 Lógica del Color – Lo Que Te Dice
- 🟩 Verde Lima → Cambio de Tendencia al Alza
Se está formando un cambio de impulso alcista. Úsalo para captar las subidas tempranas. - 🟥 Carmesí → Cambio de Tendencia a la Baja
Señala que se está acumulando presión a la baja. Te prepara para posibles posiciones cortas o salidas. - 🟧/🔴 Naranja/Rojo → Zona de Alta Volatilidad
Espera picos de precio, movimientos rápidos y posibles trampas. No es un lugar para adivinar a ciegas—confirma tu estrategia. - 🟦 Azul Acero → Zona de Baja Volatilidad
El mercado se está desacelerando, comprimiendo o moviendo lateralmente. A menudo prepara oportunidades de ruptura.
📊 Lo Que Hace (Y Lo Que No Hace)
- ✅ Mapea claramente los cambios de dirección de la tendencia
- ✅ Separa visualmente zonas de calma vs. zonas volátiles
- ✅ Superposición simple y amigable para gráficos—sin desorden
Perfil del indicador
4.6
Valoraciones: 3
5 | 67 % | |
4 | 33 % | |
3 | 0 % | |
2 | 0 % | |
1 | 0 % |
Valoraciones de clientes
August 4, 2025
No reason to yolo this live without a few normal sessions, and Bad settings can ruin the idea.
July 26, 2025
20 percent less clicking is the line to watch. Market checks feel quicker.
Los productos disponibles a través de cTrader Store, incluidos bots, indicadores y plugins para operar, son proporcionados por desarrolladores de terceros y están disponibles únicamente con fines informativos y de acceso técnico. cTrader Store no es un bróker, por lo que no proporciona asesoramiento de inversión, recomendaciones personales ni ninguna garantía de rentabilidad futura.


Desde 08/06/2025
1
Ventas