
Descripción
¿Qué es un indicador de “Rango Inicial”?
Este indicador es una versión adaptada de una herramienta de Pine Script llamada “Opening Range Breakout”.
Originalmente se llamaba ORB – Opening Range Breakout: se toma el rango de precios de los primeros minutos de una sesión, y luego se opera el ruptura de ese rango.
En esta versión lo renombramos a IR – Rango Inicial, pero la idea es la misma:
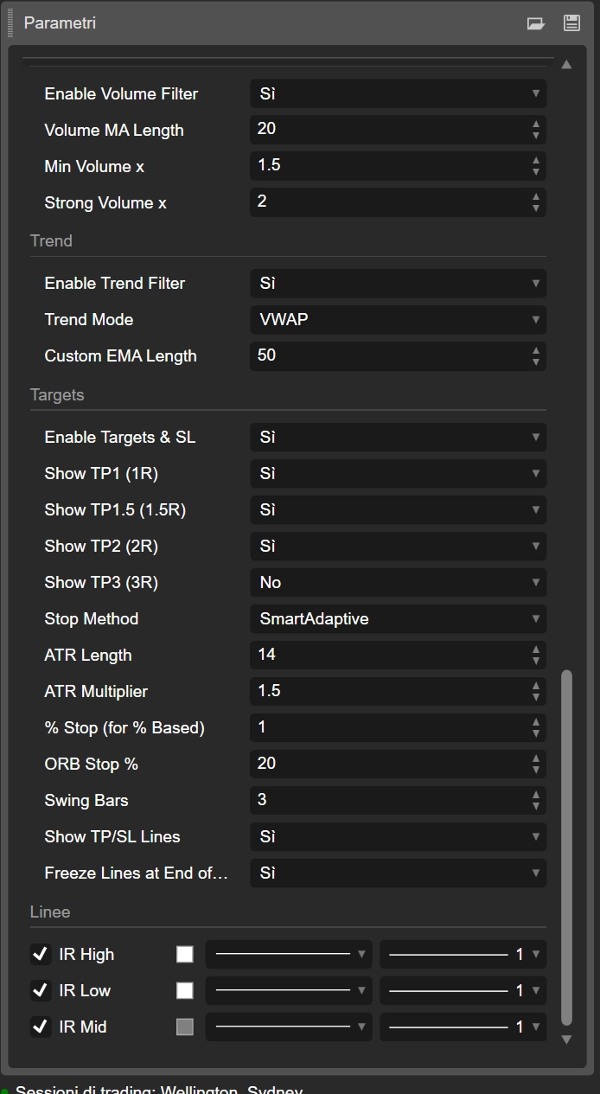
- El indicador construye varios Rangos Iniciales:
-
- IR5 – primeros 5 minutos
- IR15 – primeros 15 minutos
- IR30 – primeros 30 minutos
- IR60 – primeros 60 minutos
- Para cada IR tienes:
-
- IR High
- IR Low
- IR Mid (el punto medio del rango)
- Puedes elegir qué rangos están activos y qué colores usan.
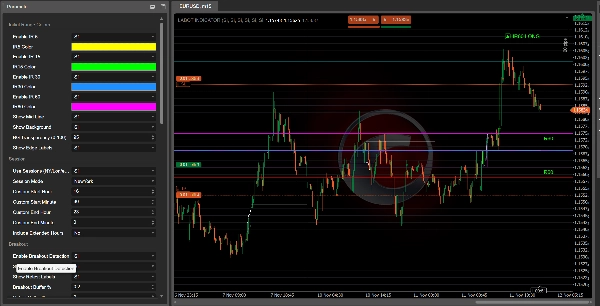
Una vez que un rango está completo, el indicador busca que el precio lo rompa:
- Ruptura por encima del IR High → IR60 LONG, IR30 LONG, etc.
- Ruptura por debajo del IR Low → IR60 SHORT, IR30 SHORT, etc.
Estas etiquetas aparecen en el gráfico para que puedas ver rápidamente qué rango inicial produjo la señal.
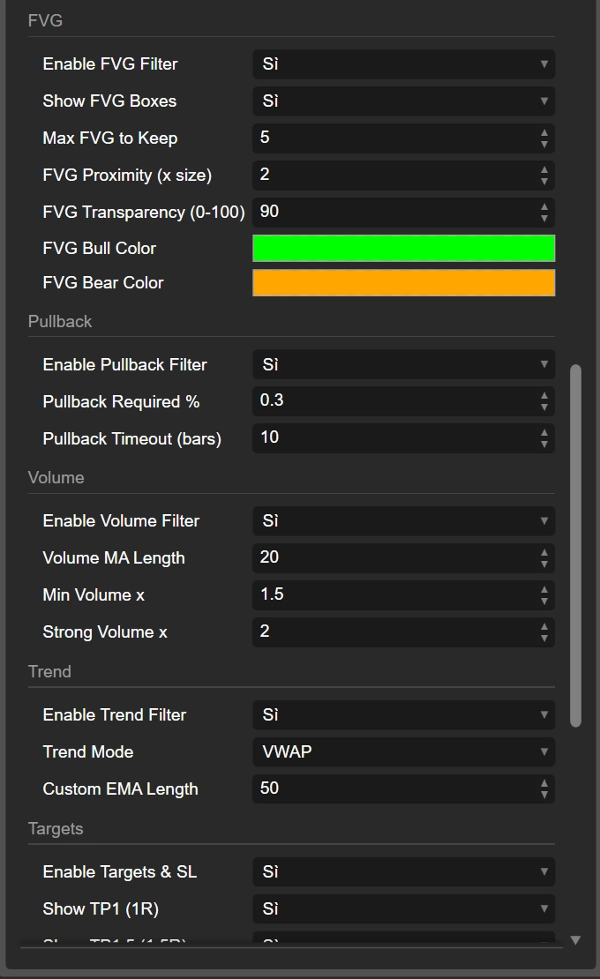
Filtros y confirmaciones
El indicador está diseñado para evitar rupturas aleatorias combinando varios filtros:
- Filtro de tendencia
Puedes usar: -
- VWAP
- EMA
- Longitud personalizada de EMA
- VWAP + EMA juntos
Se favorecen las rupturas en la dirección de la tendencia (por ejemplo, LONG solo cuando el precio está por encima de VWAP/EMA).
- Filtro de volumen
El indicador compara el volumen actual con un promedio móvil de volumen: -
- confirmación “normal”
- volumen “fuerte”
Las rupturas con volumen débil pueden ser ignoradas si lo deseas.
- Filtro FVG (Fair Value Gap)
Detecta FVG alcistas y bajistas y puede requerir que la ruptura ocurra cerca de un FVG relevante: -
- FVG alcista cerca del IR High apoya LONG
- FVG bajista cerca del IR Low apoya SHORT
- Filtro de retroceso
Puedes requerir un retroceso mínimo después de la ruptura y una ventana de tiempo (en barras) para que ese retroceso ocurra. Esto te ayuda a enfocarte en rupturas que realmente “respiran” antes de continuar.
Rupturas, retests y rupturas fallidas
Después de una ruptura del Rango Inicial, el indicador sigue lo que hace el precio a continuación:
- Cuenta cuántas barras permanecen fuera del rango.
- Verifica si el precio se mueve lo suficientemente lejos (distancia mínima en %).
- Luego observa un retest de regreso al rango.
Puedes ver:
- IR60 LONG / IR60 SHORT (ruptura)
- Retest LONG / Retest SHORT etiquetas cuando el precio regresa después de un movimiento sólido
- Failed LONG / Failed SHORT etiquetas cuando una ruptura falla rápidamente y el precio vuelve a entrar al rango sin compromiso.
Esto te da tres tipos de información:
- ruptura limpia
- ruptura saludable con retest
- ruptura falsa/fallida
Objetivos, stop loss y visualización de la operación
El indicador también calcula niveles automáticos de TP y SL basados en:
- ATR
- % del ancho del IR
- stops % fijos
- puntos de giro
- modos ATR “inteligentes” adaptativos y escalados
Desde el precio de entrada y el nivel de stop calcula varios objetivos:
- TP1 (1R)
- TP1.5 (1.5R)
- TP2 (2R)
- TP3 (3R)
Puedes elegir qué objetivos mostrar.
Las líneas se dibujan en el gráfico:
- IR_ENTRY_LONG / IR_ENTRY_SHORT
- IR_SL_LONG / IR_SL_SHORT
- IR_TP1 / IR_TP1.5 / IR_TP2 / IR_TP3
Cuando el precio alcanza un objetivo o stop, el estado se actualiza y las líneas pueden “congelarse” ya sea después del último TP o al final del día, dependiendo de tus configuraciones.
En resumen
- Nombre antiguo: ORB (Opening Range Breakout)
- Nombre nuevo: IR (Rango Inicial) – mismo concepto, nombre más limpio
- Construye rangos de sesión temprana (IR5, IR15, IR30, IR60)
- Marca rupturas LONG / SHORT, retests, y rupturas fallidas
- Usa filtros de tendencia, volumen, FVG y retroceso para mejorar la calidad
- Dibuja entrada, stop y múltiples objetivos directamente en el gráfico
Así que cuando ves “IR60 LONG” en el gráfico, básicamente estás viendo una ruptura del Rango Inicial en los primeros 60 minutos de la sesión – solo que con un nombre más moderno, personalizable y mucha lógica extra detrás.
Resumen
The indicator marks breakout signals when price moves above the range high (LONG) or below the range low (SHORT), displaying corresponding labels on the chart. It also tracks retests and failed breakouts, distinguishing clean breakouts, healthy retests, and fake moves.
To improve signal quality, the indicator incorporates multiple filters: trend filters using VWAP and EMA, volume filters comparing current volume to averages, Fair Value Gap (FVG) filters detecting bullish or bearish imbalances near breakout levels, and pullback filters requiring minimum retracements after breakouts.
Additionally, it calculates and plots automatic entry, stop loss, and multiple take profit levels based on ATR, percentage of the initial range width, fixed percentages, swing points, and adaptive ATR modes. These visual aids help traders manage risk and targets directly on the chart.
The Initial Range indicator supports various markets including Forex, stocks, indices, commodities, and cryptocurrencies, and is designed to enhance breakout trading strategies with customizable parameters and comprehensive trade visualization.
Valoraciones de clientes
5 | 100 % | |
4 | 0 % | |
3 | 0 % | |
2 | 0 % | |
1 | 0 % |


