
present
Daftar dan dapatkan diskon $50 untuk pembelian pertama Anda
Trading product for Market Bias Dashboard Indikator Premium/Discount  Key Levels, image 1
Market Bias Dashboard
Indikator
Versi 1.0, Jul 2026
Windows, Mac
Trading product for Market Bias Dashboard Indikator Premium/Discount  Key Levels, image 2
Trading product for Market Bias Dashboard Indikator Premium/Discount  Key Levels, image 3
Trading product for Market Bias Dashboard Indikator Premium/Discount  Key Levels, image 4

Deskripsi

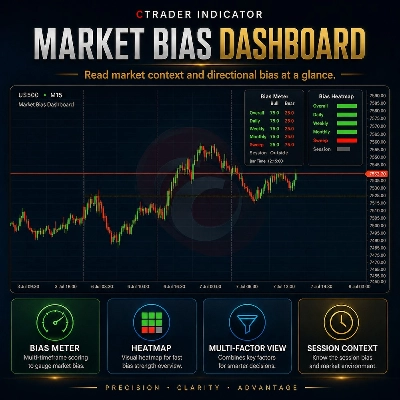
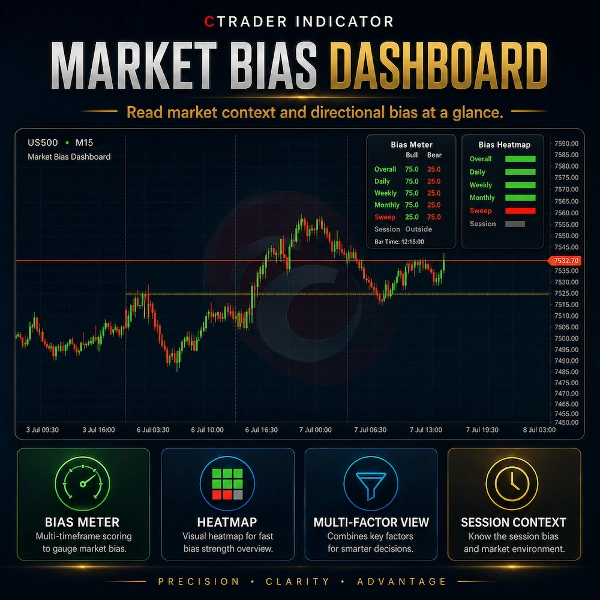
Market Bias Dashboard adalah indikator visual cTrader yang dirancang untuk merangkum konteks pasar langsung di grafik Anda.


Dashboard mengevaluasi titik referensi aksi harga yang dipilih seperti level keseimbangan hari sebelumnya, minggu sebelumnya, dan bulan sebelumnya, status sesi saat ini, serta penyapuan likuiditas terbaru yang terdeteksi. Hasilnya ditampilkan dalam tata letak Bias Meter dan Bias Heatmap yang bersih.


Penting: Nilai Bull/Bear yang ditampilkan bukan probabilitas statistik, data sentimen pasar langsung, atau prediksi tingkat kemenangan perdagangan. Nilai tersebut adalah keadaan konteks visual tetap yang digunakan untuk memudahkan pembacaan dashboard.


Dashboard menggunakan logika status berikut:


Konteks bullish: 75 / 25

Konteks netral atau campuran: 50 / 50

Konteks bearish: 25 / 75


Misalnya, jika harga berada di atas level keseimbangan yang dipilih, komponen tersebut dapat ditampilkan sebagai konteks bullish. Jika harga berada di bawahnya, dapat ditampilkan sebagai konteks bearish. Jika konteks tidak jelas, tidak tersedia, atau campuran, dapat ditampilkan sebagai netral.


Fitur utama:

- Panel Bias Meter yang bersih

- Panel Bias Heatmap

- Konteks CE hari, minggu, dan bulan sebelumnya

- Tampilan konteks premium / diskon

- Status sesi saat ini

- Konteks penyapuan likuiditas opsional

- Garis referensi opsional

- Posisi panel yang dapat disesuaikan

- Warna dan pengaturan tampilan kustom

- Indikator yang aman untuk toko dengan hak akses terbatas


Market Bias Dashboard hanyalah alat visualisasi grafik dan konteks pasar. Ini tidak mengeksekusi perdagangan, tidak memodifikasi pesanan, dan tidak memberikan sinyal beli atau jual yang dijamin.


Perdagangan melibatkan risiko. Indikator ini tidak memberikan nasihat keuangan, rekomendasi investasi, probabilitas statistik, atau hasil perdagangan yang dijamin.

Ringkasan

Ringkasan AI
Market Bias Dashboard is a cTrader indicator that visually summarizes market context on your chart. It evaluates key price action reference points including previous day, week, and month equilibrium levels, current session status, and recent liquidity sweeps. These elements are presented through a Bias Meter and Bias Heatmap, indicating bullish, bearish, or neutral market states based on price positioning relative to equilibrium levels. The dashboard’s bias states use fixed visual values (bullish: 75/25, neutral: 50/50, bearish: 25/75) to simplify interpretation and do not represent probabilities or trading signals. Features include premium/discount context views, optional liquidity sweep indicators, adjustable panel positioning, customizable colors and display settings, and reference lines. The tool is designed solely for market context visualization and does not execute trades or provide financial advice. It supports analysis of trend strength and reversal signals using bar data and is categorized under trend indicators. Tags associated with the product highlight its focus on structure and smart money concepts such as key levels, liquidity grabs, and risk dashboards.
Profil indikator
Kategori indikator
Tren
Tipe output
Visualisasi
Persyaratan data
Hanya batang
Sinyal yang didukung
Reversal
Kekuatan tren

Ulasan pelanggan

0.0
Ulasan: 0
Ulasan pelanggan
Belum ada ulasan untuk produk ini. Sudah mencobanya? Jadilah pemberi ulasan pertama!

Diskusi

Pertanyaan umum

Premium/Discount
Key Levels
Liquidity Sweep
Risk Dashboard
Liquidity Grab
Produk-produk yang tersedia melalui cTrader Store, termasuk bot trading, indikator, dan plugin, disediakan oleh pengembang pihak ketiga serta hanya ditujukan untuk akses teknis dan informasi. cTrader Store bukan broker dan tidak menyediakan saran investasi, rekomendasi pribadi, atau jaminan apa pun tentang kinerja di masa mendatang.

Produk lain dari penulis ini

Indikator
SMC
Prop
+5
Automatically draws the Opening Range (High & Low) for Tokyo, London, and New York sessions. Configurable start times,
Indikator
Liquidity Grab
Liquidity Sweep
+2
Visualizes accumulation ranges, manipulation sweeps and distribution phases on your cTrader chart.
Indikator
BOS
Key Levels
+2
Maps bullish and bearish order block zones, CE levels and structure-based price action context.
Indikator
MSS
Key Levels
+2
Maps equal highs, equal lows and active liquidity pools directly on your cTrader chart.
Indikator
BOS
MSS
+3
Maps BOS, CHoCH, swing breaks and market structure shifts directly on your cTrader chart.
Indikator
EMA
RSI
+2
Compact premium cTrader dashboard for market bias, sessions, premium/discount context, liquidity direction, ADR range an
cBot
ATR
EMA
+4
Professional Supply & Demand Execution Bot for cTrader. CS Apex Hunter Pro is a fully automated execution bot designed
7.6%
ROI
3.17
Faktor laba
Indikator
SMC
Prop
+12
Killzone, ICT, SMC, Session, Asia, London, New York, NY PM, Session High, Session Low, Smart Money, Order Flow, Trading
Indikator
MSS
Key Levels
+4
Maps session ranges, previous highs/lows, equilibrium and premium/discount zones on your cTrader chart.

Anda mungkin juga suka

Indikator
Volume
Key Levels
Dynamic Visible Range Volume Profile for cTrader. Real-time POC, Value Area & Smart Alerts for precise trading.
Logo "Market Structure Shift"
Peringkat teratas
4.2
(4)
$19
/
$35
Indikator
Prop
Forex
+11
Market Structure Shift – Professional Market Structure Oscillator
Indikator
Breakout
Allow trader to visualize Support & Resistance across different timeframes,give trader an overview of the current market
Logo "Stochastic RSI PRO"
Peringkat teratas
4.6
(6)
$28
/
$40
Indikator
RSI
Prop
+14
Unlock Stochastic RSI PRO in cTrader! Overlay RSI, highlight zones, and identify divergences with customizable settings.
Indikator
RSI
VegaXLR's cTrader StochRSI identifies overbought/oversold RSI levels for precise trade entries.
Indikator
BOS
CHOCH
+2
The full SMC suite: structure BOS CHoCH MSS , FVG, liquidity, order blocks & a 0 to100 confluence score. No repaint.
Indikator
Indices
Breakout
+1
You can use the cTrader Pivot Points Pro indicator to find a good pullback entry in a trend
Indikator
SMC
Forex
+5
Pure Price Action ICT Tools
Indikator
ATR
Forex
+2
Trade fearlessly: auto-adjusts order blocks, manages risks, and ensures precision. Was Free for early users now -80%
Indikator
ATR
Prop
+15
Initial Range – Where the open writes the script.
Indikator
RSI
Breakout
+1
🚀 TrendHeikinMultiMA: Advanced trend detection using Heikin-Ashi smoothing & MAs! Eliminates noise, confirms real trend
Indikator
BOS
CHOCH
+5
MyZTrade High TF candle is a multi-timeframe visualisation tool that overlays completed higher-timeframe candles.
Indikator
Forex
BTCUSD
+10
MultiTimeframe MA
Indikator
ATR
MSS
+5
Grades ICT Unicorn setups (Breaker Block + FVG confluence) into PRIME / SETUP / WATCH, with retest & RR targets.
Indikator
AI
SMC
+9
Identifies market trends (-10 to +10) using HMA with volume confirmation. Includes customizable alerts.
Indikator
Prop
VWAP
+15
VWAP: Follow the smart money. Trade with real volume and the fair price on your side!
Indikator
BOS
CHOCH
+3
Identifies HH, HL, LH, and LL swing points using fractals. Essential for Smart Money Concepts and price action.
Indikator
ATR
BOS
+3
Fair Value Gaps with Multi-Timeframe.

Harga

4
Penjualan

























