
Higher TimeFrame Candle Tracker
Indicateur
1 achats
Version 1.0, Oct 2025
Windows, Mac
Description
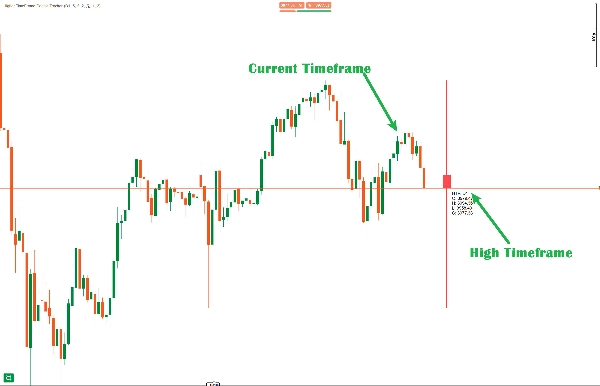
Le traqueur de chandeliers de timeframe supérieur est utilisé pour avoir un aperçu de l'apparence du chandelier du timeframe supérieur sélectionné.
Caractéristiques principales :
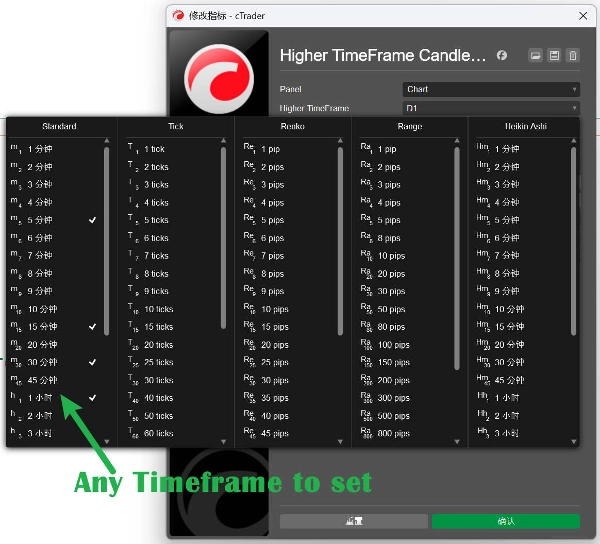
- Sélection de timeframe personnalisable - Choisissez n'importe quel timeframe supérieur (Journalier, Hebdomadaire, Mensuel, etc.)
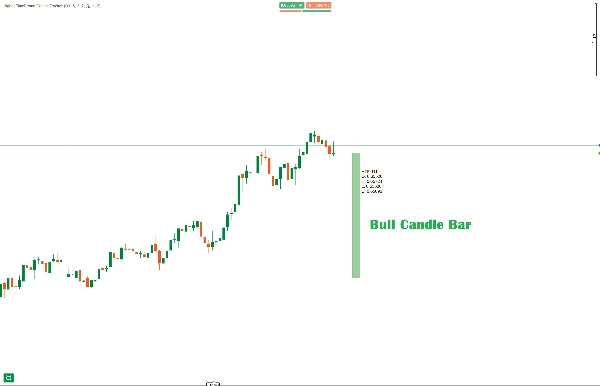
- Affichage visuel du chandelier - Le chandelier HTF actuel est tracé avec des mèches et un corps appropriés, décalé par rapport à l'action de prix actuelle
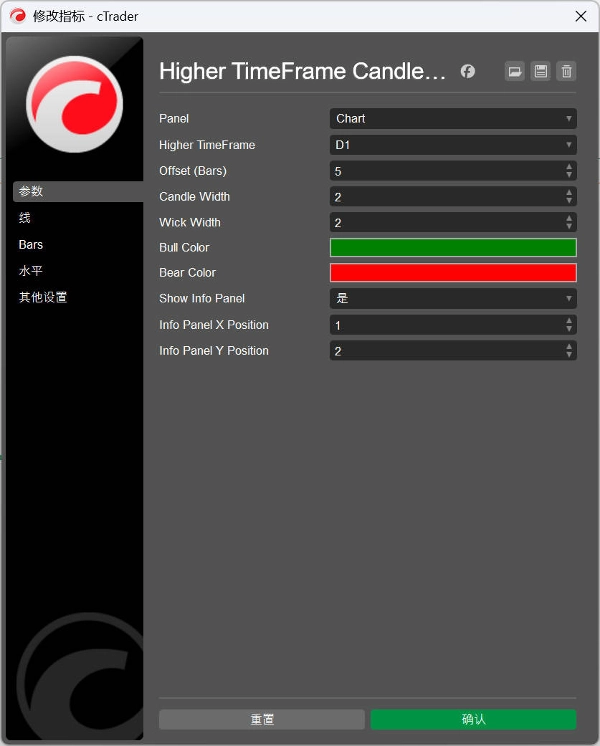
Paramètres ajustables :
- Décalage : Distance en barres par rapport au prix actuel (par défaut : 5)
- Largeur du chandelier : Épaisseur du corps du chandelier (1-10, par défaut : 3)
- Largeur de la mèche : Épaisseur des lignes de mèche (1-5, par défaut : 1)
- Couleurs : Couleurs personnalisables pour les haussiers (vert) et les baissiers (rouge)
TimeFrame supporté:
- Minute, Minute2, Minute3, Minute4, Minute5
- Minute10, Minute15, Minute30, Minute45
- Hour, Hour4, Hour12
- Daily, Day2, Day3
- Weekly, Monthly
Tableau d'information - Affiche les données en temps réel du chandelier HTF : valeurs d'ouverture, haut, bas, clôture.
中文说明:
可自定义参数:
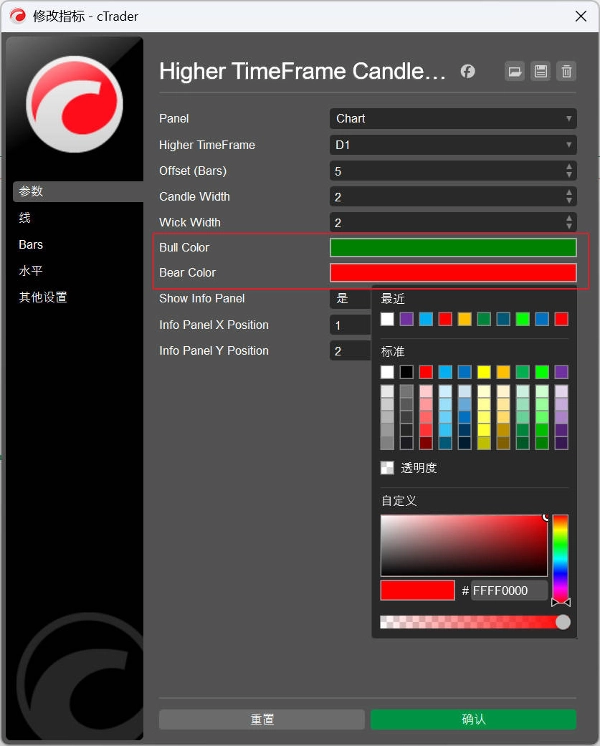
- Higher TimeFrame(高时间框架) - 选择要跟踪的时间框架(默认:Daily)
- Offset(偏移量) - K线距离当前价格的位置(默认:5根K线)
- Candle Width(K线宽度) - K线实体的宽度(1-10,默认:3)
- Wick Width(影线宽度) - 影线的宽度(1-5,默认:2)
- Bull Color(看涨颜色) - 看涨K线颜色(默认:Green)
- Bear Color(看跌颜色) - 看跌K线颜色(默认:Red)
- Show Info Panel(显示信息面板) - 是否显示HTF数据面板(默认:true)
核心特性:
- 实时HTF K线显示 - 在图表上绘制当前高时间框架K线
- 完整的K线结构 - 包含实体、上影线和下影线
- 颜色区分 - 自动根据涨跌使用不同颜色
- 信息面板 - 显示Open、High、Low、Close和方向指示
- 自适应填充 - 看涨K线半透明,看跌K线较深
支持的时间框架:
- Minute, Minute2, Minute3, Minute4, Minute5
- Minute10, Minute15, Minute30, Minute45
- Hour, Hour4, Hour12
- Daily, Day2, Day3
- Weekly, Monthly
Résumé
Profil de l'indicateur
Avis clients
0.0
Avis : 0
Avis clients
Il n'y a pas encore d'avis sur ce produit. Vous l'avez déjà essayé ? Soyez le premier à en parler aux autres !
Discussion
Questions fréquentes
Prop
Forex
Breakout
Indices
Commodities
Crypto
Stocks
Les produits disponibles sur cTrader Store, notamment les bots de trading, les indicateurs et les plug-ins, sont fournis par des développeurs tiers et mis à disposition à titre informatif et à des fins d'accès technique uniquement. cTrader Store n'est pas un courtier et ne fournit aucun conseil en investissement, aucune recommandation personnelle ni aucune garantie quant aux performances futures.


![Logo de "[Stellar Strategies] Inside Bar with Signals"](https://cdn.ctrader.com/image/webp/1d9e8bfa-3b2c-4440-bb37-5856902008a7_30683)


Prix
Depuis le 30/09/2024
44
Ventes